Real Time Analytics Platform: How It Works and How to Pick
Your store is busy right now. Somewhere in the past twenty minutes, a shopper added three items to a cart, removed one, opened your shipping policy in a second tab and left. Another typed a product name into search, got nothing useful, and bounced. You'll meet both of them tomorrow, as two abandoned carts in a report that arrives long after either could have been helped.
That gap between what's happening and what you can see is the whole case for a real time analytics platform. Not the refresh speed on a pricing page, not the number of widgets on a dashboard. The useful question is whether the software can show you a shopper's intent while there's still time to respond to it.
There's a catch, and it runs through everything below. Speed amplifies whatever it touches. Point a fast dashboard at clean, well-identified events and your team makes better calls sooner. Point it at duplicated sessions, stale customer records and bot traffic, and you'll make wrong decisions faster and with more confidence. So the criteria that matter are tail latency (how slow the slow requests get, not the average) and data trust (whether what you're looking at is real). This guide builds from what these platforms do, through how a single click travels to a screen, to the tests that separate a working setup from an expensive one.
Table of Contents
- What a Real Time Analytics Platform Does
- How Data Flows from Click to Dashboard
- Core Metrics and Features to Expect
- Evaluation Criteria and a Platform Checklist
- Pitfalls, Data Trust and Best Practices
- How to Set Up Live Tracking and Escalation Rules
- Real-World Examples and Business Impact
- Confirm Your Platform Choice Before You Buy
<a id="what-a-real-time-analytics-platform-does"></a>
What a Real Time Analytics Platform Does
At three in the afternoon a merchant opens yesterday's sales report, checks the morning's revenue, and closes the tab. Nothing in that report mentions the four shoppers who filled carts in the past hour and walked away, or the search term six visitors typed that returned nothing at all. The information exists. It just arrives tomorrow, in a shape nobody can act on.
A real time analytics platform is the software that closes that gap. It ingests customer events as they happen, page views, searches, add-to-cart and remove-from-cart actions, checkout starts, completed orders, and republishes them as metrics that update within seconds while the visit is still in progress.
<a id="the-rear-view-mirror-and-the-windshield"></a>
The rear-view mirror and the windshield
Batch reporting is the rear-view mirror. It tells you, accurately and with confidence, where you have been: which campaigns worked last week, which product page converts, how returns trended last quarter. Keep it. You need it for planning, buying and finance.
Live analytics is the windshield. It tells you what's directly ahead, in time to steer. A cart sitting idle for nine minutes with a shipping question still open is a thing you can fix now. The same cart in tomorrow's report is a statistic.
Three questions separate the two modes, and only the live system answers them in time:
- Who is here right now? Active visitors, the pages they've reached, the products they're comparing, the device and the traffic source that sent them.
- Where are they stuck? A cart that gained an item and lost it. A search with no result. Three visits to the returns policy in one session.
- What should someone do next? Open the exact cart, answer the question, send the recovery message, or leave the shopper alone because they're moving fine on their own.
This capability sits in front of your warehouse, not in place of it. Historical business intelligence explains the pattern; live data catches the individual case the pattern is made of. Most stores need both, and the merchants who get the most from live data are usually the ones with a solid reporting habit already.
It's also no longer a niche technical function. Of 560 business leaders surveyed for a Harvard Business Review Analytic Services report in February and March 2025, nearly two-thirds said real-time customer analytics was important to their organization's performance at the time, and nearly 80% expected it to matter within the following two years.
Start here: write down three signals your store cannot see today. Items added to a cart and later removed. Searches that returned no results. A wholesale account that opened the same bulk product page four times this morning. Those three are your requirements list, and they're worth more than any feature comparison you'll read.
<a id="how-data-flows-from-click-to-dashboard"></a>
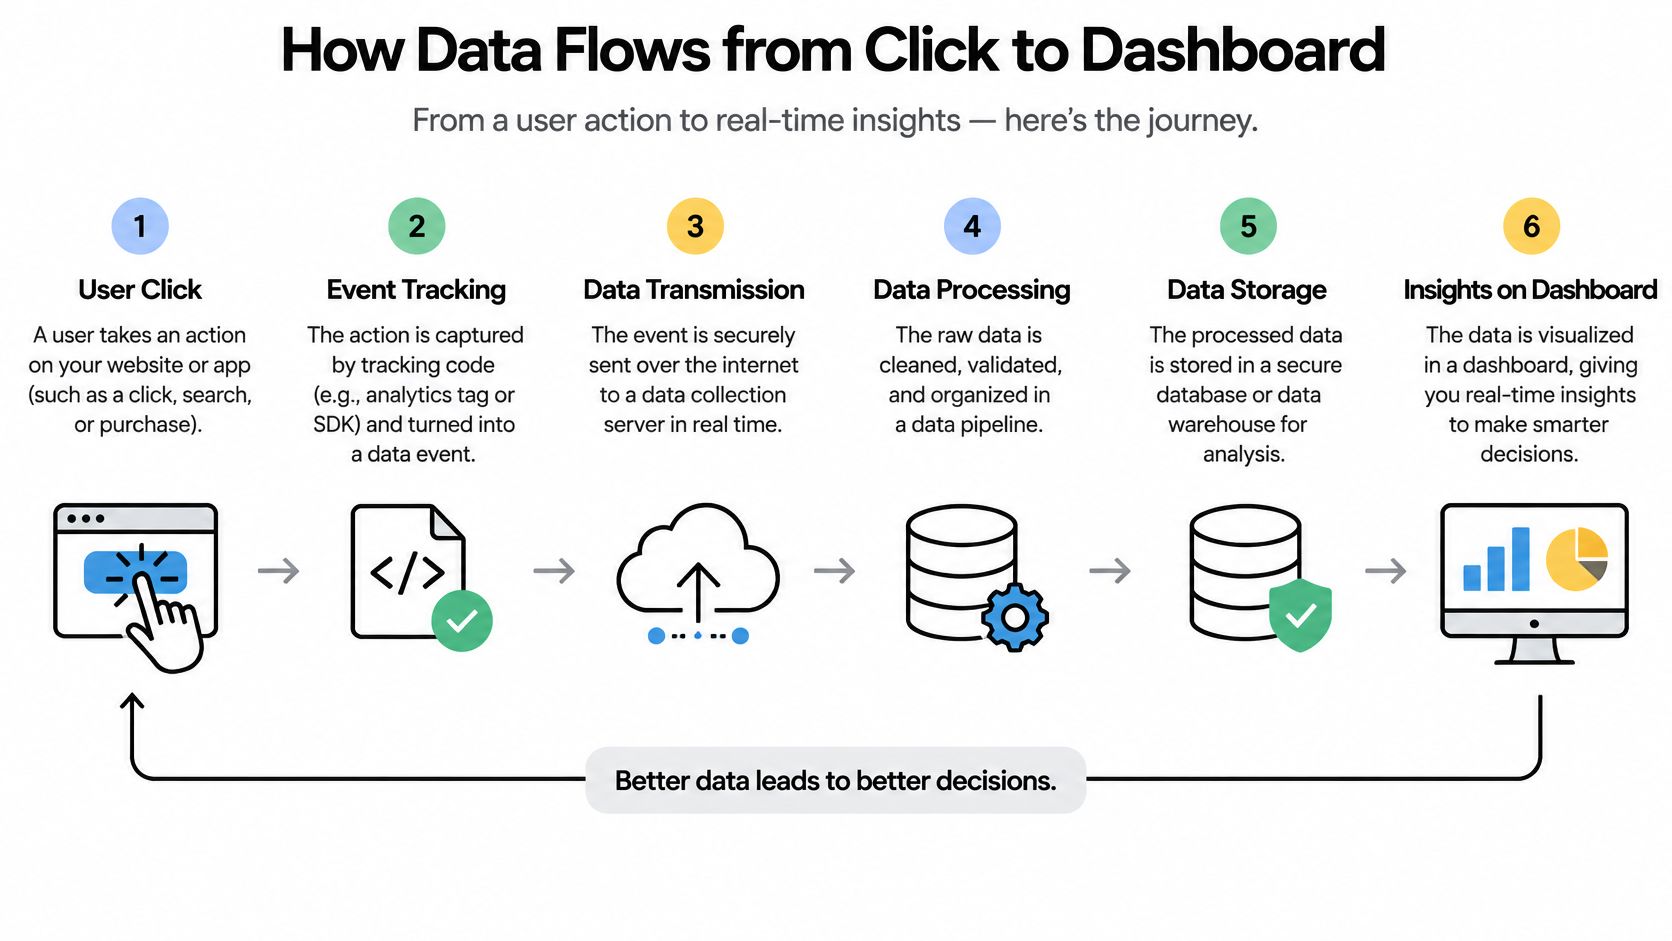
How Data Flows from Click to Dashboard
Trace one ordinary action. A shopper taps the minus button on a cart line, removing a sweater. That single click is the smallest complete story in your store, and following it shows you exactly where a live dashboard can go wrong.
The path from that click to a support agent's screen has four moving parts, and any one of them can be the reason your feed shows something untrue.
Capture. A script in the browser or a storefront webhook packages the event: what happened, which session, which cart, which product, when. It leaves within the page request. The common failure here is silent: ad blockers, consent tools and privacy browsers drop tracking scripts, and you never learn which events went missing.
Ingest. The event lands in a durable, partitioned log. Milliseconds matter, but ordering matters more, because the log is what lets you replay a day and rebuild a cart that a dashboard corrupted.
Process. A stateful operator updates the cart's current state, subtracting the sweater, adjusting the item count, recalculating value. This stage is where late events cause damage.
Serve. The dashboard, the live feed and any support widget re-query the state layer and repaint. Your stated target should be under one second at p95.
| Stage | What Happens | Latency Target | Failure to Watch |
|---|---|---|---|
| Capture | Browser or storefront event sent | Within the page request | Dropped events from blocked scripts |
| Ingest | Event written to a partitioned log | Milliseconds | Consumer lag building up |
| Process | Cart and session state updated | Sub-second per window | Late events leaving the wrong cart state |
| Serve | Dashboard and widget refreshed | Under 1 second at p95 | Stale views after a refresh |
<a id="why-the-partition-key-decides-whether-the-story-holds-together"></a>
Why the partition key decides whether the story holds together
Partition events by a stable key, a session ID, cart ID or customer ID, and every page view, search, add and removal for that shopper lands in the same place. Correlation becomes a local lookup. Partition by anything unstable, or leave it random, and correlating a removal with the add that preceded it becomes an expensive cross-partition join that degrades as traffic grows.
Late events are the second half of the problem. A shopper on a patchy mobile connection taps remove, the request retries, and the event arrives ninety seconds after it happened. Without event-time windows and watermarks, the processor treats it as new, and your support agent opens a cart that no longer matches reality. Watermarks let the system wait a bounded period for stragglers, then finalize the state.
<a id="why-the-average-hides-the-real-problem"></a>
Why the average hides the real problem
Averages flatter streaming systems. In the ShuffleBench evaluation of distributed stream-processing systems, p95 end-to-end latency came in at roughly 8 ms for Hazelcast, 88 ms for Apache Flink and 183 ms for Kafka Streams, with Spark substantially slower on the tested cloud-native shuffle workload. Same workload, same benchmark, response times an order of magnitude apart.
The number that matters for conversion recovery is the p95 or p99, because the shopper you most want to help is often the one whose session is slow. Measure p50, p95 and p99 separately, from the browser event or webhook through ingestion, state update, dashboard render and widget trigger.
Practical rule: Measure from the click to the widget. A pipeline that's fast inside the broker and slow in the dashboard is still slow to the person answering the chat.
Set an explicit objective, something like p95 visibility under one second, and monitor consumer lag, watermark delay, dropped-event rate and dashboard refresh latency as separate numbers. One blended "performance" figure will hide the one that's broken. Your next step is to find which stage would show your delays first: if your feed lags on busy mornings, look at ingest and processing. If it lags only when someone opens the dashboard, look at serve.
<a id="core-metrics-and-features-to-expect"></a>
Core Metrics and Features to Expect
Live platforms converge on a similar metric set, because these are the numbers that describe a store in motion. Use the table as a lookup for what you're buying, then read the pattern underneath it.
| Metric | What It Counts | Why Watch It |
|---|---|---|
| Visitors right now | Active visitors in the past 5 minutes | Shows traffic pressure as it builds |
| Total sales today | Gross sales minus discounts and returns, plus shipping and taxes | Tracks revenue state against the day's goal |
| Total sessions | Sessions since midnight | Gives context for conversion rate |
| Total orders | Orders placed since midnight | Shows whether traffic is turning into purchases |
| Top locations | Regions with the most visitors since midnight | Helps match staffing and shipping messages to demand |
| New vs returning customers | Breakdown of customer type | Shows whether campaigns reach new buyers |
| Top products | Best sellers by sales for the day | Shows which products need stock or promotion |
| Active carts | Sessions with one or more items in the cart | Measures the pool available for recovery |
| Checking out | Sessions on the checkout page | Shows how many buyers are close to ordering |
| Cart changes | Items added and removed | Reveals friction and hesitation before checkout |
<a id="three-groups-and-the-one-that-earns-its-keep"></a>
Three groups, and the one that earns its keep
Traffic pressure covers visitors right now, sessions, top locations and new versus returning customers. Useful for staffing a support desk or timing a campaign send. Rarely actionable on its own.
Revenue state covers total sales today, total orders, top products. Note the definition: sales equals gross sales minus discounts and returns, plus shipping and taxes. If two dashboards disagree, the argument is almost always about that formula, and a shared definition of your core business metrics settles it before anyone builds a report on top.
Friction signals cover cart changes, active carts, checkout sessions, searches and product views. This group pays for the platform. A rise in removals on one product line tells a merchandiser something today. An add-to-cart followed by no checkout for eleven minutes tells support exactly who to open.
Beyond the standard set, look for behavioral detail that turns a number into a story: which search terms returned nothing, which UTM source the idle carts came from, which device type struggles at checkout, and whether the cart timeline shows a shopper circling back to the same page. Alerts belong here too, particularly for high-value idle carts, where the value of the cart justifies interrupting someone.
Pick the five metrics that match your role and ignore the rest for a month. Support needs active carts and cart changes. Merchandising needs top products and searches. Finance needs sales today and orders, defined once and never redefined.
<a id="evaluation-criteria-and-a-platform-checklist"></a>
Evaluation Criteria and a Platform Checklist
Feature lists are easy to write and hard to verify. Turn the mechanics above into tests you can run in an afternoon, and score each one pass or fail rather than "looks good."
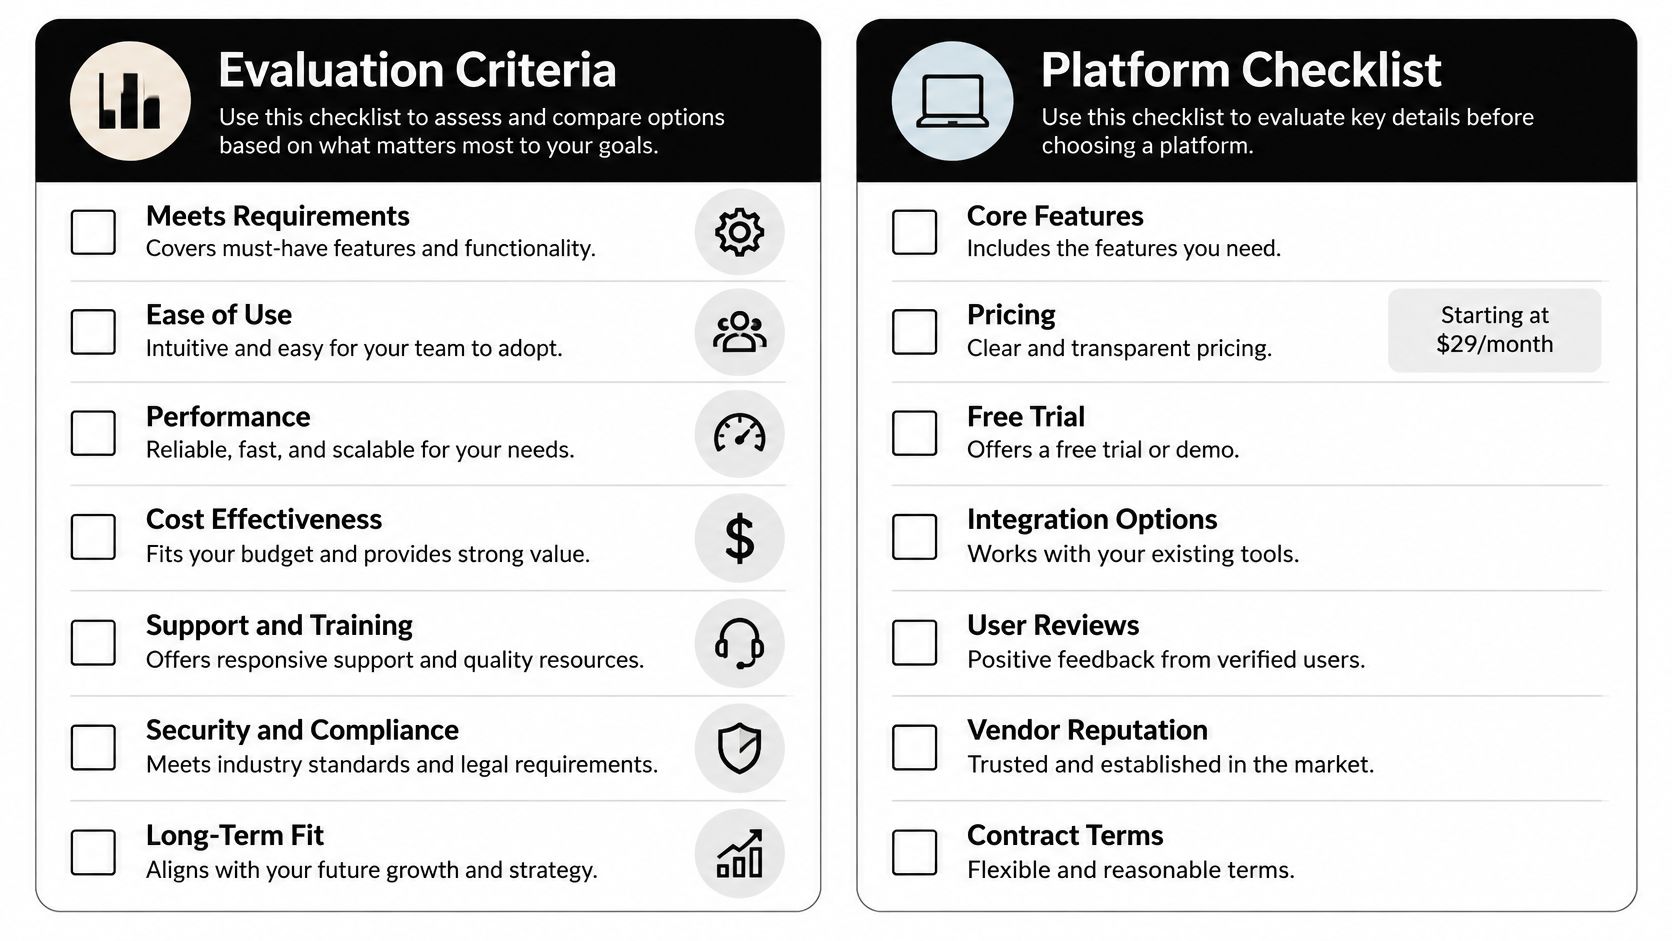
| Criterion | Test to Run | Pass Signal |
|---|---|---|
| Tail latency | Measure p95 and p99 from event to widget | p95 stays under 1 second |
| Burst capacity | Load test from 500 to 10,000 messages per second | Lag does not keep growing at peak |
| Event correlation | Add and remove a test item | Both events appear under one cart ID |
| Late-event handling | Send a delayed remove event | Cart state corrects within the window |
| Retention and export | Check cart history length and export a day of data | History covers your dispute window and exports cleanly |
| Identity and bot filtering | Review documented rules and test a refresh | Duplicates and bots are labeled or excluded |
| Role-based access | Log in as sales and as support | Each role sees only the data it needs |
| Alert controls | Set a threshold and check the test alert | Alert fires once, to the right person |
<a id="capacity-means-bursts-not-averages"></a>
Capacity means bursts, not averages
Test against peak, not against a quiet Tuesday. The RIoTBench benchmark for distributed stream processors exercises systems across 27 reusable streaming tasks and workloads running from 500 to 10,000 messages per second, covering preprocessing, summarization and predictive work. That range is a reasonable planning envelope for commerce, where a product launch or a B2B buying session can multiply traffic inside ten minutes.
While you test, vary event size, partition count, join cardinality and checkpoint frequency. Record throughput, p95 and p99 latency, recovery time after a forced failure, and how long a state rebuild takes. A platform that survives the burst but takes twenty minutes to reconstruct carts afterwards has failed a different test.
<a id="the-go-or-no-go-rule"></a>
The go or no-go rule
Score each row pass or fail and write the decision rule before testing starts. A workable rule: no-go if tail latency, event correlation or identity filtering fails, because the first makes intervention untimely, the second makes it wrong, and the third makes it untrustworthy at scale. Burst capacity can be a conditional pass if your traffic is genuinely steady and your vendor documents a scaling path.
Run the tests on a real cart, not on a demo. Vendors describe their systems accurately but generously, and a test cart with two items reveals more than a sales call. If you want a starting point, Cart Whisper | Live View Pro is one Shopify option to put through this checklist before you commit to anything, and its Cart ID feature gives you a concrete thing to verify: add and remove an item, then confirm the app opens the exact cart you're testing.
<a id="pitfalls-data-trust-and-best-practices"></a>
Pitfalls, Data Trust and Best Practices
Here's the uncomfortable part of the argument. A dashboard that refreshes every two seconds is a multiplier, and it doesn't care whether the input is sound. Weak identity resolution plus fast rendering equals a team confidently contacting the wrong person about a cart they never built.
The scale of the problem is measurable. A 2025 global survey of mid-market and enterprise organizations, reported by Melissa's global intelligence research, found 84% struggle with inaccurate or duplicate data. The leading causes were outdated contact information at 32%, changing data regulations at 25% and incomplete customer profiles at 23%. Every one of those shows up in a live feed as a plausible-looking session.
| Failure mode | Warning sign | Fix |
|---|---|---|
| Duplicate sessions | Visitor count far above session count | Deduplicate by session and cart ID and document the rule |
| Bots and crawlers | Visits with no add-to-cart or checkout activity | Filter known bots and label the remaining traffic |
| Shared devices | Items from two shoppers appear in one cart | Separate carts by account and verify identity before acting |
| Stale customer records | Alerts reach a former contact | Refresh contact data before routing alerts |
| Consent-restricted visitors | Activity shown for visitors who opted out | Apply consent rules in the tracking setup and hide restricted data |
| Incomplete B2B identities | Company name missing on high-intent sessions | Match company identity before any sales outreach |
| Cart adds that never reach checkout | Add events with no checkout follow-up | Compare against completed orders every week |
<a id="practices-that-keep-the-feed-honest"></a>
Practices that keep the feed honest
- Label confidence on every metric. Distinguish an identified logged-in customer from an anonymous session, and let the interface say which one a support agent is looking at.
- Write down your deduplication and bot rules. A rule that lives in an engineer's head is a rule that disappears when they leave, and it can't be audited.
- Set retention by identity type. Short windows for anonymous sessions, longer timelines for authenticated accounts and wholesale buyers who need a dispute trail.
- Handle consent where tracking starts. Consent handling bolted on at the dashboard will eventually display something it shouldn't.
- Reconcile live against completed orders weekly. This is the single practice that catches quiet drift, and our guide to best practices for data collection covers the underlying setup in more detail.
A live number you can't trace back to a completed order is a rumor with a timestamp.
Three symptoms tell you the feed has drifted. Visitor counts far above session counts. Cart additions that never convert into checkout starts at the rate your history predicts. One customer triggering the same alert five times in an hour. Each points at a specific rule, not at the platform being broken.
Log the weekly gap. Write down the difference between the cart activity your feed reports and the orders your store completed, week by week. Then set a maximum acceptable gap, and treat any alert raised while the gap is wider than that as informational until you've found the cause.
<a id="how-to-set-up-live-tracking-and-escalation-rules"></a>
How to Set Up Live Tracking and Escalation Rules
Live data becomes revenue only when someone owns a response. Shopify's B2B ecommerce research illustrates the size of that gap: only 47% of B2B leaders consider their current sales platform very effective at creating personalized buying experiences. Collecting behavior is the easy half. Coordinating a reply across support, sales and ecommerce is the hard half.

Intervention has to be selective. Immediate outreach rescues a wholesale buyer sourcing 400 units. The same outreach interrupts a self-service shopper who is ninety seconds from paying, and it can leak account detail to whoever happens to be watching the screen.
Escalation rule: Outreach is for sessions where the customer has signaled a blocker, a quote request, or high value with a long idle time. Silence is the default for everyone else.
- Install and confirm your own visit. Open your storefront in a private window, browse two products, and check that the session appears in the live feed within seconds. Why: you're validating the capture stage before trusting anything downstream. Common slip: testing while logged in as admin, which can suppress or mislabel your own traffic.
- Verify one cart, two events. Add an item, remove it, and confirm both events appear under a single Cart ID. Why: this proves the partition key and correlation work. Common slip: accepting a feed that shows the removal but not the addition, which means events are landing in different places.
- Build one alert, not five. Set a high-value idle cart alert above a threshold you choose, then trigger it with a test cart. Why: a single alert your team trusts beats five nobody reads. Common slip: an alert that re-fires for the same customer every few minutes until people mute it.
- Map roles before you map people. Decide which team sees cart contents, customer names and company names, and keep wholesale account data with the account owner. Why: role-based access is the difference between assistance and a privacy incident. Common slip: giving the whole support desk visibility into accounts a sales rep owns, including a competitor's.
- Write the escalation path. Name who responds, within what time, and at which point outreach should stop and let the shopper finish. Why: an unassigned alert is a notification, not a process. Common slip: assuming the support lead is watching the feed during a promotion.
- Measure the intervention. Tag every assisted cart and compare completed orders against a two-week baseline. Why: assisted recovery has a cost, and you need to know whether it beats leaving shoppers alone. Common slip: celebrating recovered carts without checking whether those orders would have happened anyway.
- Connect exports to your reporting stack. Schedule a CSV export of cart timelines into the spreadsheet or warehouse your finance team already uses, and confirm one test day matches the live feed. Why: disputes and reconciliation need records, not screenshots. Common slip: exporting summary totals only, which hides the cart-level detail needed to settle a dispute.
The deliverable is a written rule set a support lead can approve in one sitting: thresholds, owners, response windows, permission table and the measurement window.
<a id="real-world-examples-and-business-impact"></a>
Real-World Examples and Business Impact
Three situations show how the pieces combine. Treat them as illustrations of the mechanics rather than measured case studies.
The shipping question. A support agent watching the live feed notices a shopper who has opened the shipping policy page three times with a full cart sitting still. She copies the Cart ID, opens that exact cart, and answers before the shopper leaves. No searching for the customer, no asking for an email. The order completes in the same session.
The wholesale hesitation. A buyer logged in under a company account spends four minutes on a bulk product page, adjusts a quantity twice and stops. The team sees the company name and the cart value, checks the quantity against the wholesale tier, and sends a quote rather than a generic discount code. The assisted order lands two hours later.
The idle high-value cart. A cart above the merchant's threshold sits untouched for eleven minutes. The alert fires once, the shopper receives a targeted message through an exit-intent recovery flow, and the cart converts. The same signal, without the alert, would have sat in a report until morning.
Each story depends on a specific output: a live activity feed for the first sighting, cart timelines for context, the Cart ID view for assisted help, and CSV export for the analysis afterwards. That's the practical test of any platform, whether the output is specific enough for a person to act on within a minute.
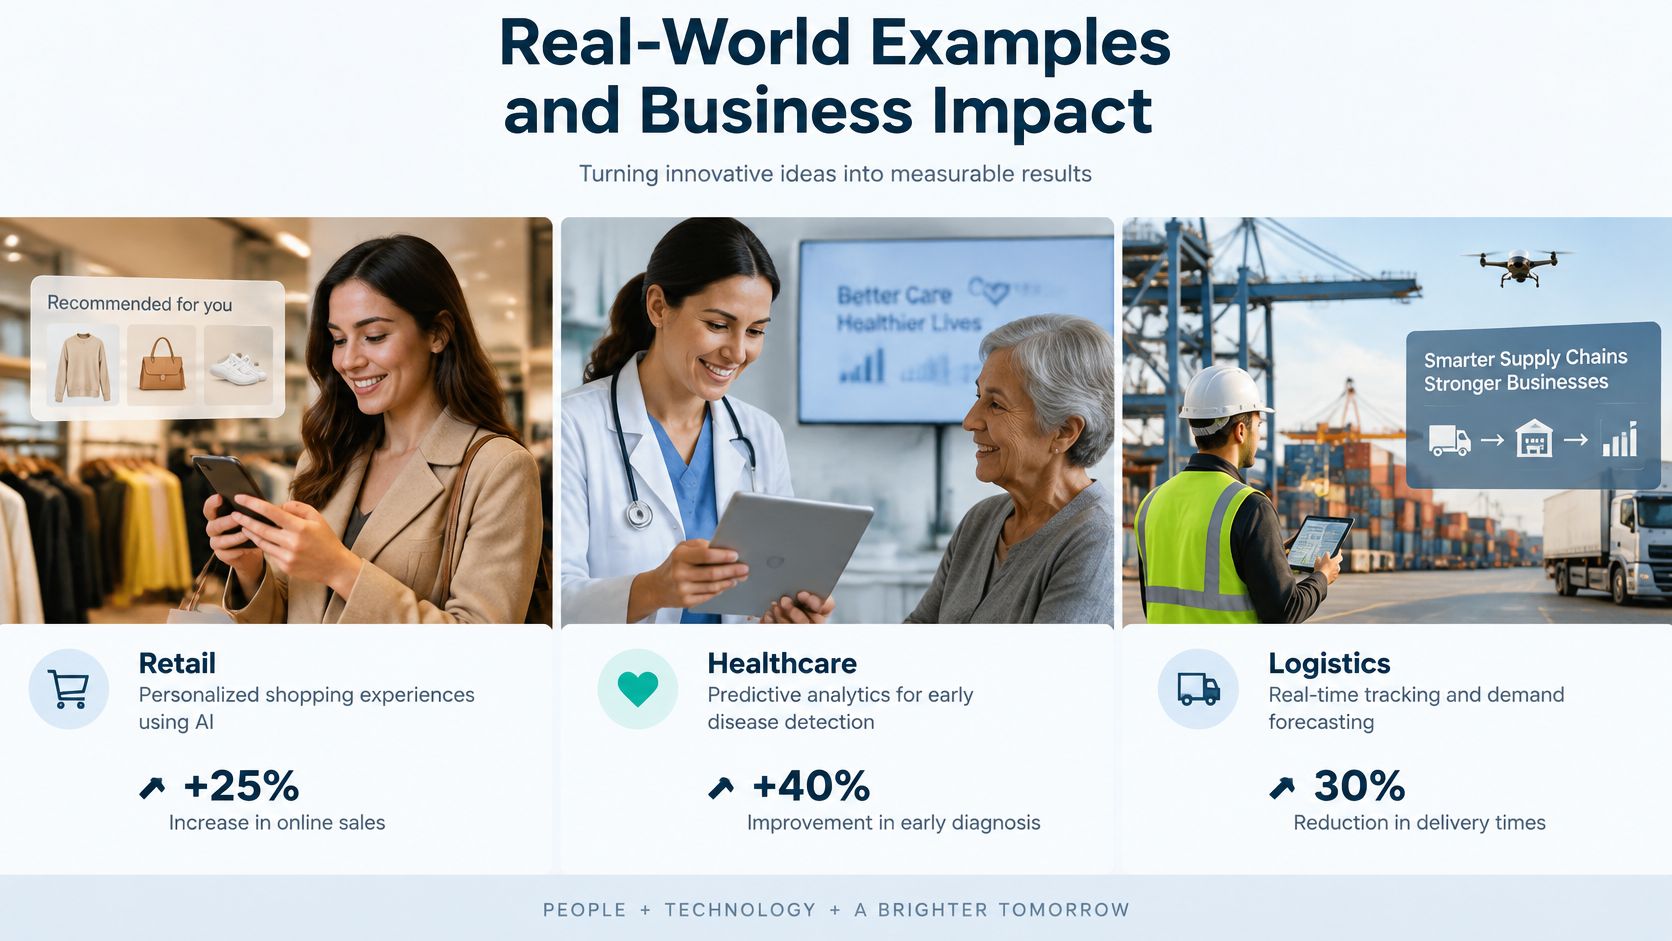
Wider survey evidence points the same direction, with caveats. The 2022 Speed to Business Value research by KX and the Centre for Economics and Business Research surveyed more than 1,200 business decision-makers across the United States, United Kingdom, France, Germany, Singapore and Australia. 80% of surveyed companies reported revenue increases they could directly relate to investments in real-time data analytics, and 98% reported improvements in customer-related outcomes, from faster service to increased sales. Those figures come from RTInsights' report on the study, which relied on survey responses and economic modeling rather than a controlled experiment.
Merchants running live cart visibility describe the same pattern in the Shopify App Store. LTW Supply puts it plainly: "This app works extremely well and provides invaluable insights into customer shopping behavior." Wheelwiz found the diagnostic value as useful as the live view: "Not only does it help me assist customers during checkout, but it helped me identify why so many carts were getting abandoned in the first place." For more layouts and metric groupings that support this kind of work, see these analytics dashboard examples.
Your results will track store traffic and response speed. A feed nobody checks produces nothing.
<a id="confirm-your-platform-choice-before-you-buy"></a>
Confirm Your Platform Choice Before You Buy
Trial a real time analytics platform only if your team can respond to what it shows. Live software bought as a reporting upgrade usually ends up as an unread tab, because the value comes from acting inside the session, and that's an operational commitment rather than a dashboard purchase.
Cart Whisper | Live View Pro is one option worth testing on a Shopify store. The Free plan costs nothing to install and includes 100 carts per month, a live activity feed, smart cart widgets, exit-intent popups and conversion of carts to draft orders, and the app carries the Built for Shopify badge. Confirm current plan limits yourself before relying on them, since pricing pages change.
Then run a fourteen-day test with the go rule written down first.
Week one is mechanical. Confirm the live feed and Cart ID accuracy on a test cart, working down the criteria table row by row. Week two is analytical. Compare live signals against completed orders, and count how many assisted carts convert. Score every criterion pass or fail, with the failing evidence attached.
Go rule: Go only if the latency target you set holds in your own store, and the weekly gap between live cart activity and completed orders sits inside the limit you agreed.
Finish by recording a written go or no-go decision, with the test results attached and the name of the person who approved it. A decision with a name on it gets revisited in six months. A decision without one becomes a subscription.
Cart Whisper | Live View Pro gives your team the live feed, the cart timelines and the Cart ID view that this whole approach depends on, so a support agent can open a shopper's exact cart and help them finish an order while they're still on your store. The Free plan installs at no cost with 100 carts per month, a live activity feed, smart cart widgets and exit-intent popups, which is enough to run the two-week test described above on real traffic. Start the free plan, run week one against the criteria table, and keep it only if the numbers earn it: Cart Whisper | Live View Pro.