What Is Customer Analytics? a Practical Guide for Shopify
Could a store spot the difference between a shopper who needs help and one who is browsing? Customer analytics can help answer that question by turning customer data, such as browsing, purchases, service contacts and engagement signals, into decisions about what to do next.
That distinction matters more than the number of charts on a screen. A report might show that a shopper abandoned a $180 jacket, but it cannot establish why. A late shipping cost, a missing size chart or a plan to return later are possible explanations, and each calls for a different response.
Customer analytics is useful when it helps a merchant choose a timely, proportionate action. Treating every pause as a problem risks interrupting shoppers who need no help. The aim is to identify recoverable friction, then respond without mistaking ordinary browsing for a request.
Table of Contents
- What Customer Analytics Means in Plain Terms
- Core Metrics Customer Analytics Tracks
- Privacy Rules for Linking Sessions to People
- How Raw Customer Data Becomes a Decision
- Business Value the Research Measures
- Live Cart Analytics on a Shopify Store
- Measure Whether Customer Analytics Is Working
- Start With One Live Signal This Week
<a id="what-customer-analytics-means-in-plain-terms"></a>
What Customer Analytics Means in Plain Terms
A shopkeeper who has run the same high street store for 20 years knows the regulars by name. She notices the customer who lifts the same jacket off the rail every Saturday, and she remembers the man who walked out right after asking about delivery times. Nobody handed her a report.
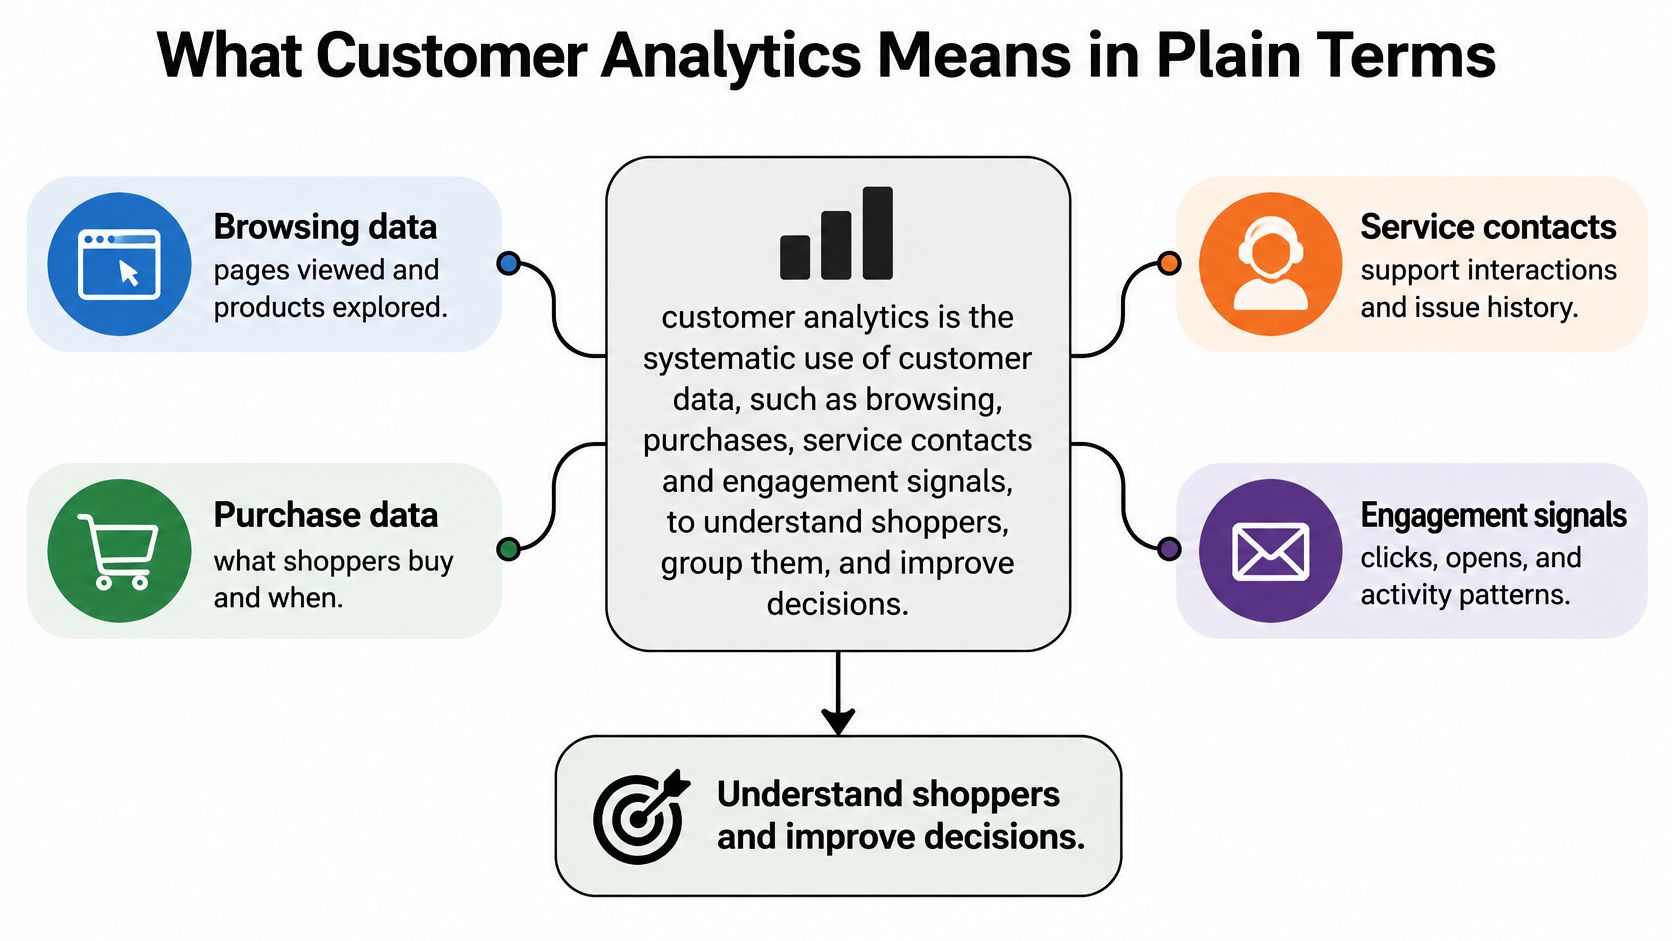
Customer analytics gives an online store that same awareness without the 20 years of memory. It records browsing behavior, purchases, service contacts and engagement signals, then converts them into a decision about what to do next.
Working definition: Customer analytics is the systematic use of customer data, such as browsing, purchases, service contacts and engagement signals, to understand shoppers, group them, predict what they need and improve decisions across marketing, sales, service and product.
<a id="the-three-layers-in-order"></a>
The Three Layers, in Order
Most confusion about what is customer analytics comes from collapsing three separate jobs into one word.
- Describing what happened. Orders, revenue, conversion rate, repeat purchases. Most dashboards stop here, and on its own it's history.
- Explaining why it happened. The shipping cost that appeared late, the size chart nobody could find, the delivery window that was never shown. This layer is where the money usually hides.
- Deciding what happens next. A help message while the shopper is still on the page, a reminder to the person who saved a cart deliberately, an offer aimed at one segment instead of everyone.
Marketing uses the third layer to decide who sees which message. Sales and assisted-selling teams use it to judge when a phone call is welcome. Support uses it to arrive before a complaint. Product operations uses it to fix the pages where people stall.
Two neighboring disciplines get mixed in constantly. Web analytics measures sessions and pages on the site. A CRM stores customer records and contact history. Customer analytics joins both kinds of data to explain behavior and choose an action, which is why it can answer a question neither one can alone.
Get those three layers in the right order and every metric that follows has a job to do.
<a id="core-metrics-customer-analytics-tracks"></a>
Core Metrics Customer Analytics Tracks
Seven metrics cover most of what a Shopify team needs, and each one answers a different question.
| Metric | What it shows | Worked example | Typical use |
|---|---|---|---|
| Recency, frequency, monetary value (RFM) | How recently, how often and how much a customer spends | A shopper who ordered 9 days ago, four times, at a $70 average outranks one who last ordered 14 months ago | Segmenting email audiences |
| Customer lifetime value (CLV) | Expected total margin from one customer | $85 average first-year margin | Setting acquisition and retention budgets |
| Conversion rate | Share of sessions that end in an order | 2 orders from 100 sessions is 2% | Judging storefront and offer changes |
| Cart abandonment rate | Share of carts started but not ordered | 25 carts started, 18 never ordered, so 72% | Finding checkout friction |
| Repeat purchase rate | Share of customers who buy again within a set period | 28% buy again within 90 days | Measuring loyalty |
| Engagement decline | Drop in visits or product views over time | Visits fall from 4 per month to 1 | Flagging customers at risk |
| Propensity score | Modeled chance of buying, leaving or responding | A model scores one cart 0.72 for a purchase within 7 days and another 0.11 | Timing offers and assisted contact |
<a id="how-the-metrics-fit-together"></a>
How the Metrics Fit Together
They aren't alternatives. RFM sorts your list into groups worth treating differently, and CLV tells you how much you can afford to spend keeping each group. Conversion rate and abandonment rate judge the storefront itself, the part of the journey you control directly. Propensity scores decide timing, which is the difference between a message that lands and one that interrupts.
A single number in isolation can mislead. A 72% abandonment rate looks alarming until you check the traffic source: a campaign aimed at people doing early research will always abandon more than a branded search visitor with a saved card. Read each metric next to the segment it came from.
A metric matters only if someone on your team can act on it this week. If nobody can, it's trivia with a decimal point.
If you want the wider vocabulary these figures sit inside, this guide to business metrics and their definitions covers the terms that surround them.
<a id="privacy-rules-for-linking-sessions-to-people"></a>
Privacy Rules for Linking Sessions to People
The instinct is that more data produces better personalization. It doesn't work that way once you try to attach a session to a person. Fragmented data is already a barrier to real-time, one-to-one experiences, and the Adobe data and insights digital trends report argues that data has to be unified across systems before it can be used that way. Unified badly, it's worse than leaving it apart: a wrong link puts someone else's browsing into a sales email.
<a id="what-a-session-actually-proves"></a>
What a Session Actually Proves
A cart ID, product views, search terms, a UTM source, a device type and a series of cart edits describe a session. They don't prove who the person is, whether they hold buying authority, or what they intend to do next. That's a gap between observed facts and predictions, and most analytics advice skips straight over it.
Three confidence levels keep the gap visible.
- Confirmed. The shopper is logged into an account. You can act with real personalization.
- Probable. The same device and email appear at checkout. Treat as likely, not certain.
- Inferred. Only a similar session pattern matches a past customer. Act only with light, reversible moves, such as a generic help widget that anyone can ignore.
Consent and retention decide what you may store at all. Collect what the shopper agreed to, set a retention window for cart history rather than keeping it forever, honor opt-outs the day they arrive, and leave sensitive data out of the pipeline entirely. The data security and privacy compliance rules that govern a store's stack apply to cart records too.
<a id="the-b2b-complication"></a>
The B2B Complication
In a wholesale account, three people may browse before one buyer places the order. Company-level activity is not one person's intent. The 2025 Adobe digital trends report shows why this matters: 73% of B2B buyers prefer online purchasing, yet 81% face factors that limit how much they can buy online. Digital behavior doesn't automatically mean the buyer can or will finish self-service.
Before any of it, four checks: confirm consent, label each link's confidence, name a human handoff for assisted orders, and measure assisted-conversion rate, time to resolution, margin after intervention and false-positive contact rate. Counting "sessions identified" tells you nothing about whether the link was right.
<a id="how-raw-customer-data-becomes-a-decision"></a>
How Raw Customer Data Becomes a Decision
Five stages separate a raw event log from a decision a person can act on. The McKinsey explainer on personalization treats the chain as a decision system built from identity resolution, data quality management, feature engineering, segmentation, propensity scoring and measurement, with data quality prioritized over sheer data volume.
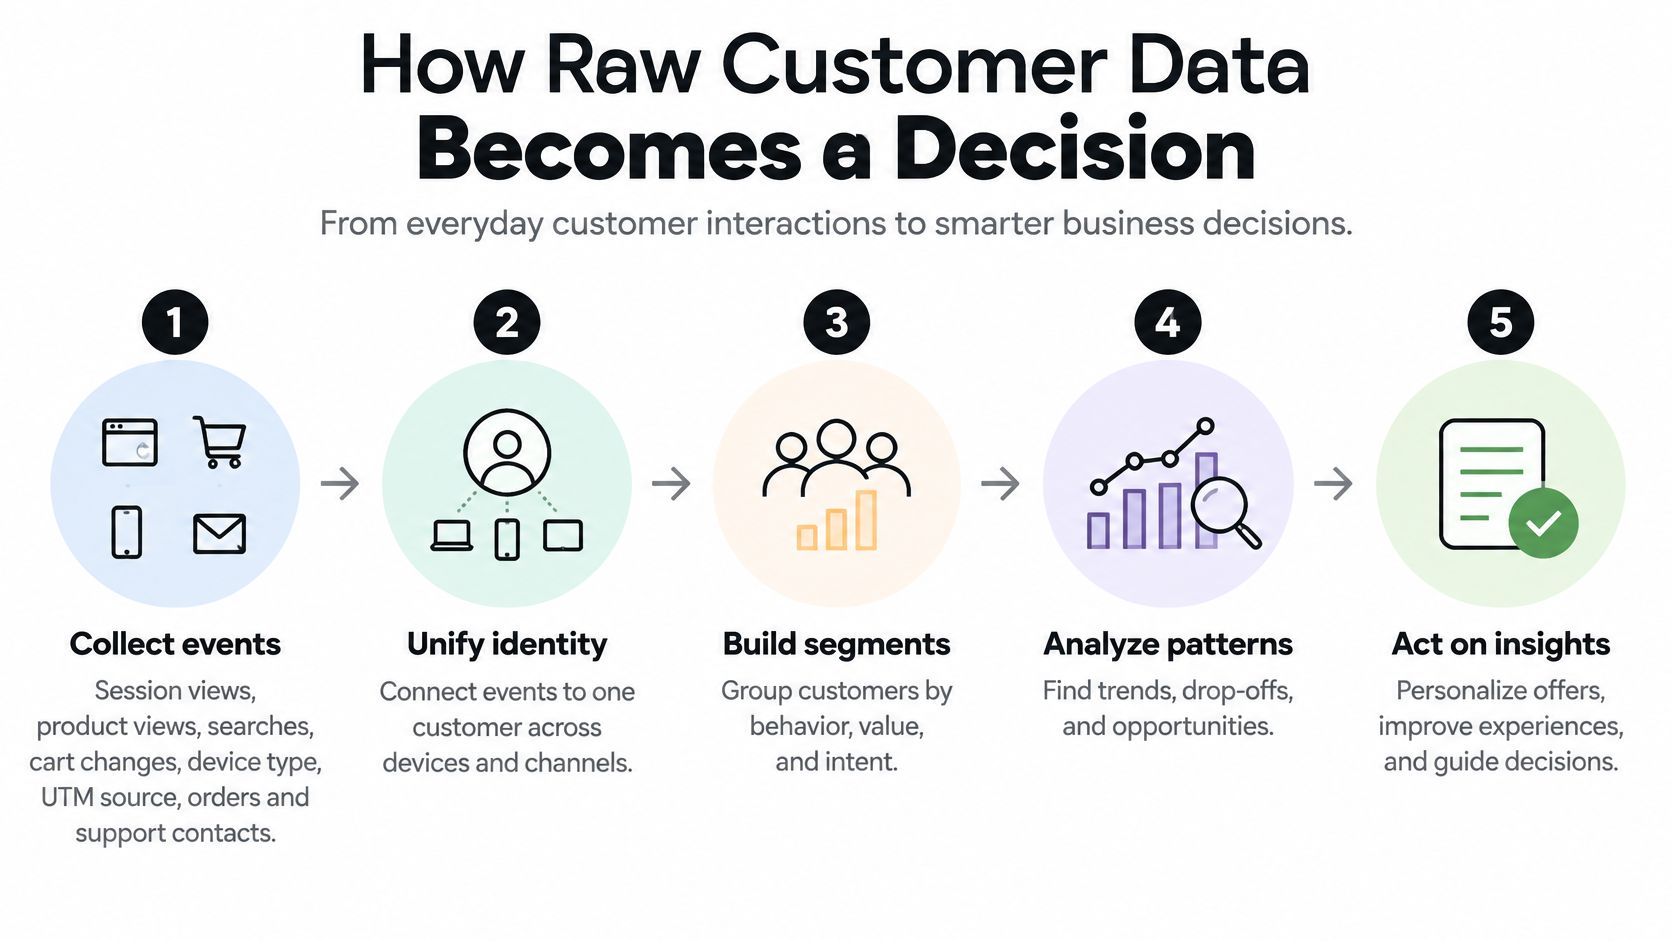
- Collect the events. Session views, product views, searches, cart additions and removals, device type, UTM source, orders and support contacts. Breadth matters because friction usually appears in the gap between two event types, not inside a single one.
- Unify identity. Join those events into one timeline per customer or account using stable identifiers such as a cart ID or an account login, and record how each join was made so you can audit it later.
- Clean and deduplicate. A page refresh that logs three views and a timestamp recorded out of order will distort any score you build on top. Fixing this is unglamorous and decides whether the rest works.
- Engineer features and score. Repeated product views suggest consideration, cart removals suggest friction, and activity on a wholesale account suggests buying interest. Models then estimate propensities such as purchase, abandonment, churn or response to an intervention.
- Act, then feed the result back. Trigger a message, a help widget or a draft order, and record whether it converted. Without that feedback loop, the model never learns which interventions are worth repeating.
Stage four is where most merchants trip. One cart removal is a data point. Three removals across two visits, a shipping-page view and a return to the same product is a signal worth acting on. Treat the live cart event as a feature inside a longer journey, not as an isolated alert.
The test to apply: can you trace one customer's last five actions to one specific decision? If not, the pipeline stops at stage four.
<a id="business-value-the-research-measures"></a>
Business Value the Research Measures
The strongest early benchmark is a 2013 McKinsey DataMatics survey of 418 senior executives across Europe, the Americas and Asia, published in McKinsey's five facts on customer analytics and corporate performance. It compared companies applying analytics broadly and intensively, which it called champions, with companies using data sporadically.
| Reported outcome | Champions | Laggards |
|---|---|---|
| Sales well above competitors | 50% | 22% |
| Above-average turnover growth | 43% | 15% |
| Significantly higher return on investment | 45% | 18% |
The return on investment row deserves a second look. 45% versus 18% means intensive users were about 2.6 times as likely to report significantly higher ROI. Read that as an association across surveyed companies, not proof that analytics alone produced the gain.
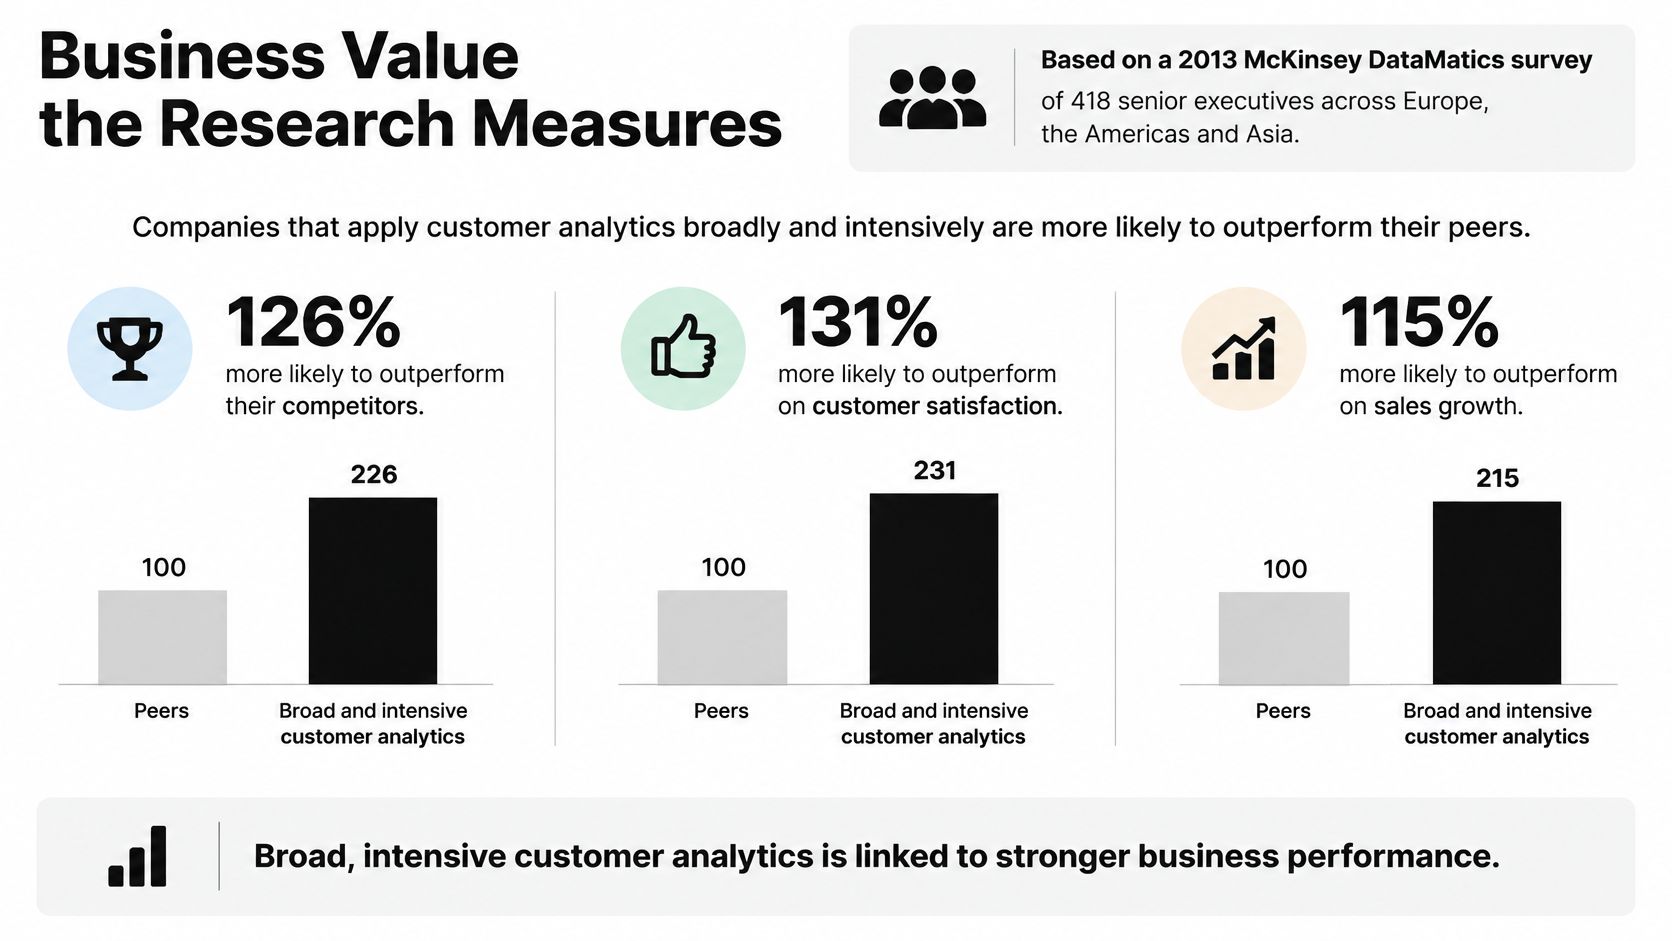
Two caveats keep the numbers honest. The benchmark dates from 2013, so treat its size as a directional signal rather than a forecast for your store. And later McKinsey work reports that more than 85% of companies using customer analytics extensively believed it made a significant contribution to business value, according to McKinsey's research on why customer analytics matter. Belief and performance are related, not identical.
Where the value shows up in day-to-day commerce is narrower than a survey headline suggests:
- High-intent identification. Spotting the shopper who returns to one product three times is worth more than another newsletter.
- Friction detection. Finding the checkout step where people stop is a storefront fix, not a marketing one.
- Lifetime value estimates. Knowing first-year margin lets you decide what a repeat purchase is worth chasing.
- Audience choice. Picking which group is most likely to respond to an offer protects margin on the rest.
For a small shop, the practical reading is simple: the gain comes from acting on a signal while it's still live. A dashboard nobody opens on a Tuesday afternoon has never recovered an order.
<a id="live-cart-analytics-on-a-shopify-store"></a>
Live Cart Analytics on a Shopify Store
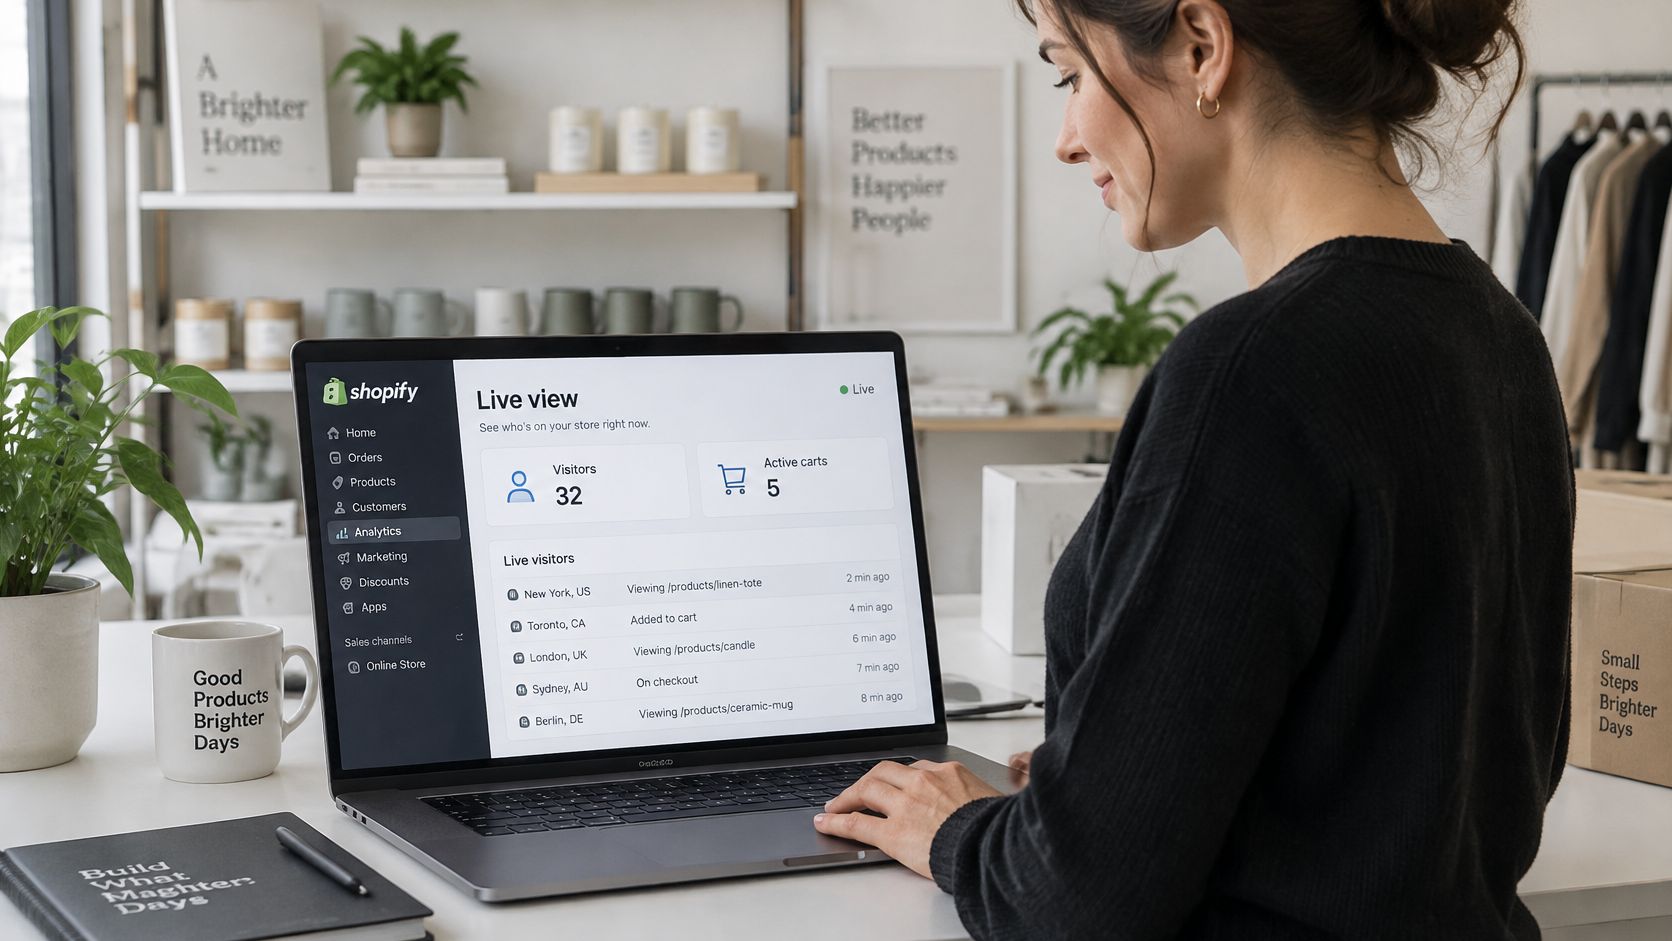
It's 2:40 on a Tuesday and five carts are open on the store.
Live View shows the merchant who is on the store and how many carts are open. Live cart analytics goes further: which products were added or removed, where a shopper stalls, and which cart belongs to someone support can help.
<a id="four-carts-four-different-responses"></a>
Four Carts, Four Different Responses
The jacket comes out of the cart right after a shipping view. A shopper adds a $180 jacket, opens the shipping page, and removes it. The store's job is to make the delivery price visible earlier and cheaper to understand, not to fire a discount code.
The size chart opens three times. Confusion, not price sensitivity. Send size help or surface the fit guide on the product page.
The shopper reaches checkout and sits idle. Something stalled in the final step. Offer assisted checkout or a direct question about payment.
The visitor only browses. Nothing happens. This person gets no message, no popup, no discount.
Those responses come from reading the live signal, not from a segment label. Reported abandonment reasons back the split: shipping costs above expectations and saving the cart for later each accounted for 30.1% of reasons, while missing delivery estimates accounted for 13.0% and slow loading for 9.3%, according to a 2025 review that separates abandonment into exploration, pre-choice and post-choice stages, each with different causes and different remedies. The same removal can mean "still deciding" or "never at this price."
"Not only does it help me assist customers during checkout, but it actually helped me identify why so many carts were getting abandoned in the first place." Wheelwiz, Shopify App Store
Sending help to every abandoned cart damages the experience and the margin at once. A shopper who saved a cart deliberately and gets a 15% discount for patience learns to wait for discounts. The aim is profitable, relevant assistance, and real-time ecommerce analytics is what makes relevance possible at that speed.
Cart Whisper | Live View Pro is one app that surfaces this cart-level activity, and the same logic works with any store analytics stack. The tool matters less than the discipline of matching an action to a specific observed signal.
<a id="measure-whether-customer-analytics-is-working"></a>
Measure Whether Customer Analytics Is Working
A model can predict abandonment without helping the store recover revenue. The test is whether acting on its signals improves outcomes compared with leaving similar carts alone. A 2025 benchmark of behavioral prediction models illustrates why prediction is only a starting point: across telecommunications and retail banking datasets, gradient boosting reached an area under the curve of 0.80 and an F1 score of 0.55, while XGBoost reached 74.2% accuracy. Those results show useful patterns, not certainty about what any individual shopper will do.
<a id="run-it-as-a-test-not-a-report"></a>
Run It as a Test, Not a Report
Keep a holdout group so you can separate the effect of an intervention from what would have happened anyway. For example, flag 1,000 carts, offer help to 500, and leave the other 500 alone.
If 12% of the helped carts convert and 8% of the control carts convert, that is a 4-percentage-point lift. It means 60 orders in the helped group compared with 40 in the control group, or 20 additional orders. Then check whether the added margin covers discounts and assistance costs.
Review four measures:
- Lift against the holdout group, measured over the same period.
- Margin after discounts and assistance costs, because extra orders can still lose money.
- Contact rate and false-positive rate, which show whether shoppers are being interrupted unnecessarily and support time is being spent on carts that did not need help.
- Time to resolution, which helps distinguish an intervention that resolved a problem from one that merely delayed the purchase.
Also check whether the highest-scored carts convert more often than lower-scored carts. If they do not, the model may be detecting patterns that predict behavior without identifying shoppers who will benefit from help. Analytics works as an intervention system only when the signal identifies recoverable friction, rather than ordinary browsing.
<a id="start-with-one-live-signal-this-week"></a>
Start With One Live Signal This Week
Pick one decision to improve, such as abandonment at the shipping step, and one live signal to watch for seven days, such as cart removals right after a shipping view or three product views without an add-to-cart.
- Write the question in one sentence. "Do shoppers who open the shipping page abandon more often than those who don't?"
- Confirm consent and set a retention window for exactly the data you need, no wider.
- Check what your platform already shows. On Shopify, Live View shows visitors and active carts, which is often enough to start.
- Create a holdout group that receives no intervention, and leave it alone.
- Review after 14 days, reading margin and contact rate alongside conversion.
If your store already gives you cart-level visibility, point it at this test and let the holdout group, not your instincts, decide whether the help worked.
Customer analytics is only as useful as the decision it changes.
Cart Whisper | Live View Pro gives Shopify merchants a real-time feed of who is on the store, which products they add or remove, and which cart a support conversation belongs to, so the decision happens while the shopper is still there. You can open a shopper's exact cart with a Cart ID, turn a cart into a draft order for assisted sales, and compare the results against a holdout group before rolling the same play out store-wide. Visit Cart Whisper | Live View Pro to watch your own live carts this week.