Real Time Data Visualization: Latency Targets Explained
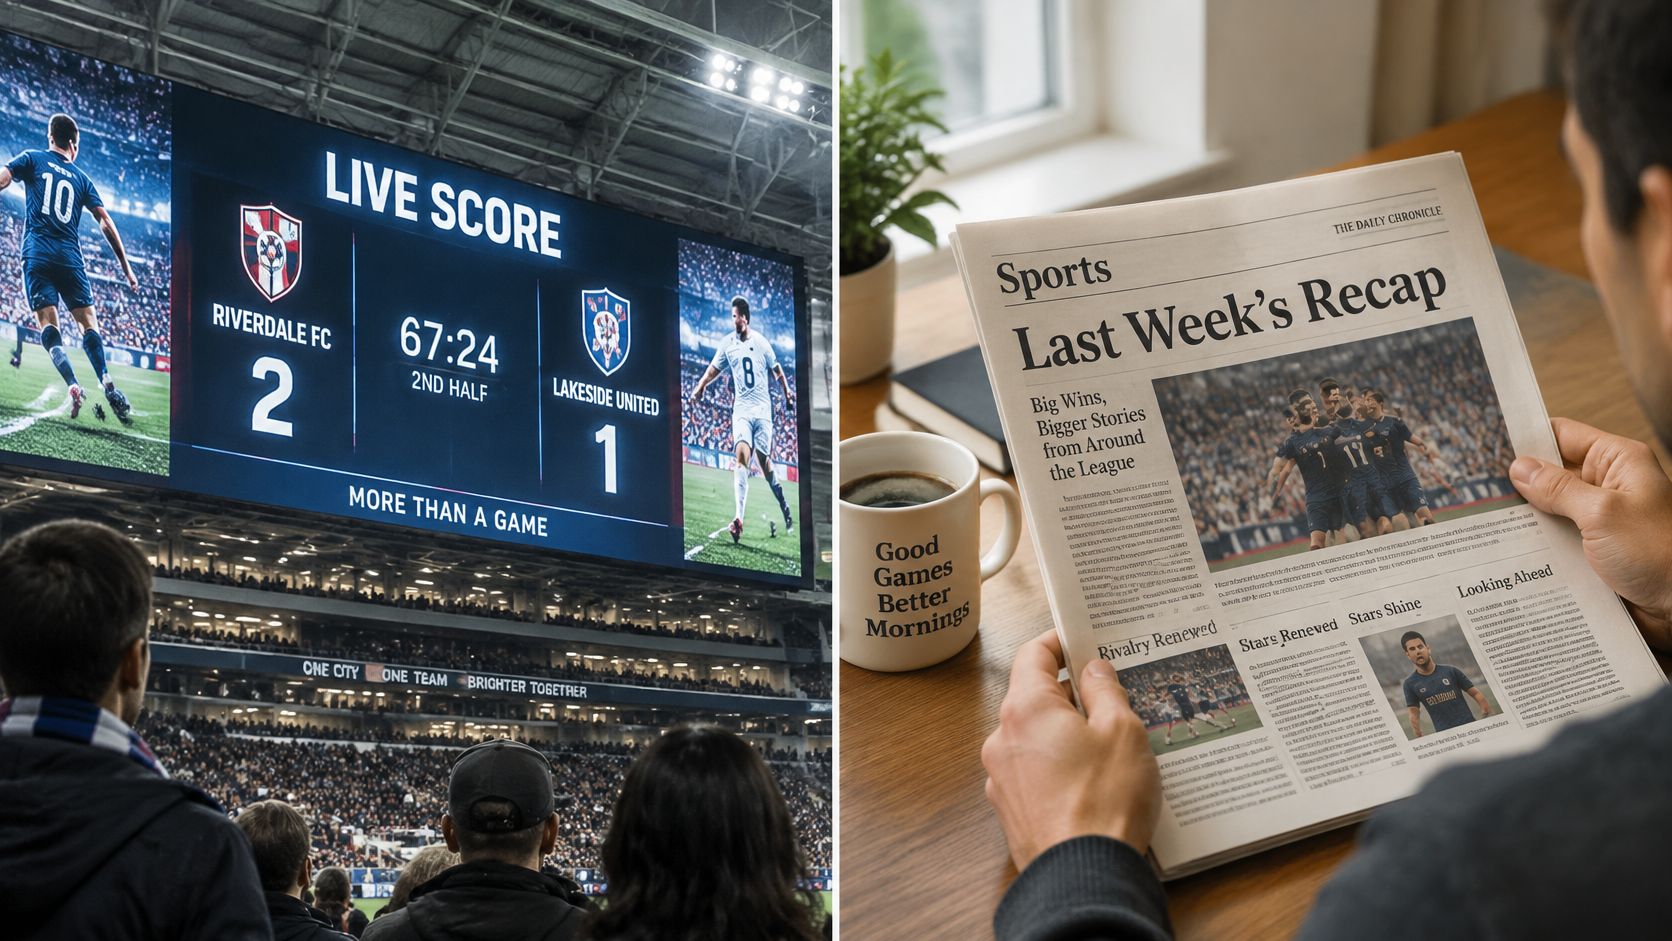
You've just sent a campaign, shoppers are arriving, and support is waiting for questions. Your sales report hasn't changed, though, so you can't tell whether visitors are browsing happily or getting stuck at shipping. You need something closer to a stadium scoreboard than a Sunday sports column: a view of what's happening while you can still respond.
Table of Contents
- What Real-Time Data Visualization Means
- How a Live Pipeline Moves Each Event
- Latency Budgets for Each Interaction
- Dashboard Patterns That Keep Staff Focused
- Live Shopper and Cart Feeds in Practice
- When Live Data Should Trigger Action
- Privacy and Trust in Live Shopper Views
- Run a One-Decision Pilot This Week
<a id="what-real-time-data-visualization-means"></a>
What Real-Time Data Visualization Means
A scoreboard changes as the plays happen. A sports column explains the result after the match. Real-time data visualization applies the scoreboard idea to business activity: a chart, counter, or activity feed refreshes as events arrive, letting someone notice a change while it's still unfolding.
For a merchant, those events might be product views, searches, cart additions, removals, and checkout starts. Instead of waiting for a completed sales report, a support agent can watch a shopper's cart journey develop. That doesn't mean every event deserves attention, only that the information is available before the opportunity to help disappears.
A review published through the Association for Computing Machinery reports that people can detect high-level structures in a graph within approximately 100 milliseconds, faster than a typical blink. But detecting a spike isn't the same as accurately estimating its size. Put exact values, timestamps, and filters beside the chart so staff can verify what caught their attention.
<a id="three-update-modes-and-when-each-fits"></a>
Three update modes and when each fits
These are illustrative operating profiles, not guarantees attached to the terms. Your actual data age must be measured from the event's creation to its appearance on screen.
| Mode | Typical data age | How data arrives | Common ecommerce use |
|---|---|---|---|
| Batch reporting | Hours to days in a scheduled reporting setup | Scheduled exports or nightly loads | Monthly sales review |
| Near-real-time | Seconds to minutes in a polling setup | Micro-batches or polling | Hourly stock-level review |
| Streaming real-time | A target of under a few seconds | Events pushed as they happen | Live cart activity |
Refresh speed and freshness aren't interchangeable. A chart can redraw instantly while showing an old export. Conversely, fresh events can reach the browser while an overloaded interface struggles to display them.
Practical rule: Choose the update mode by asking how long the decision can wait, not how impressive the dashboard looks.
If a stock review can wait through a polling cycle, near-real-time may be sufficient. If support must respond during an active checkout, streaming deserves consideration. The useful target is the shortest reliable path from signal to action, not maximum immediacy everywhere.
<a id="how-a-live-pipeline-moves-each-event"></a>
How a Live Pipeline Moves Each Event
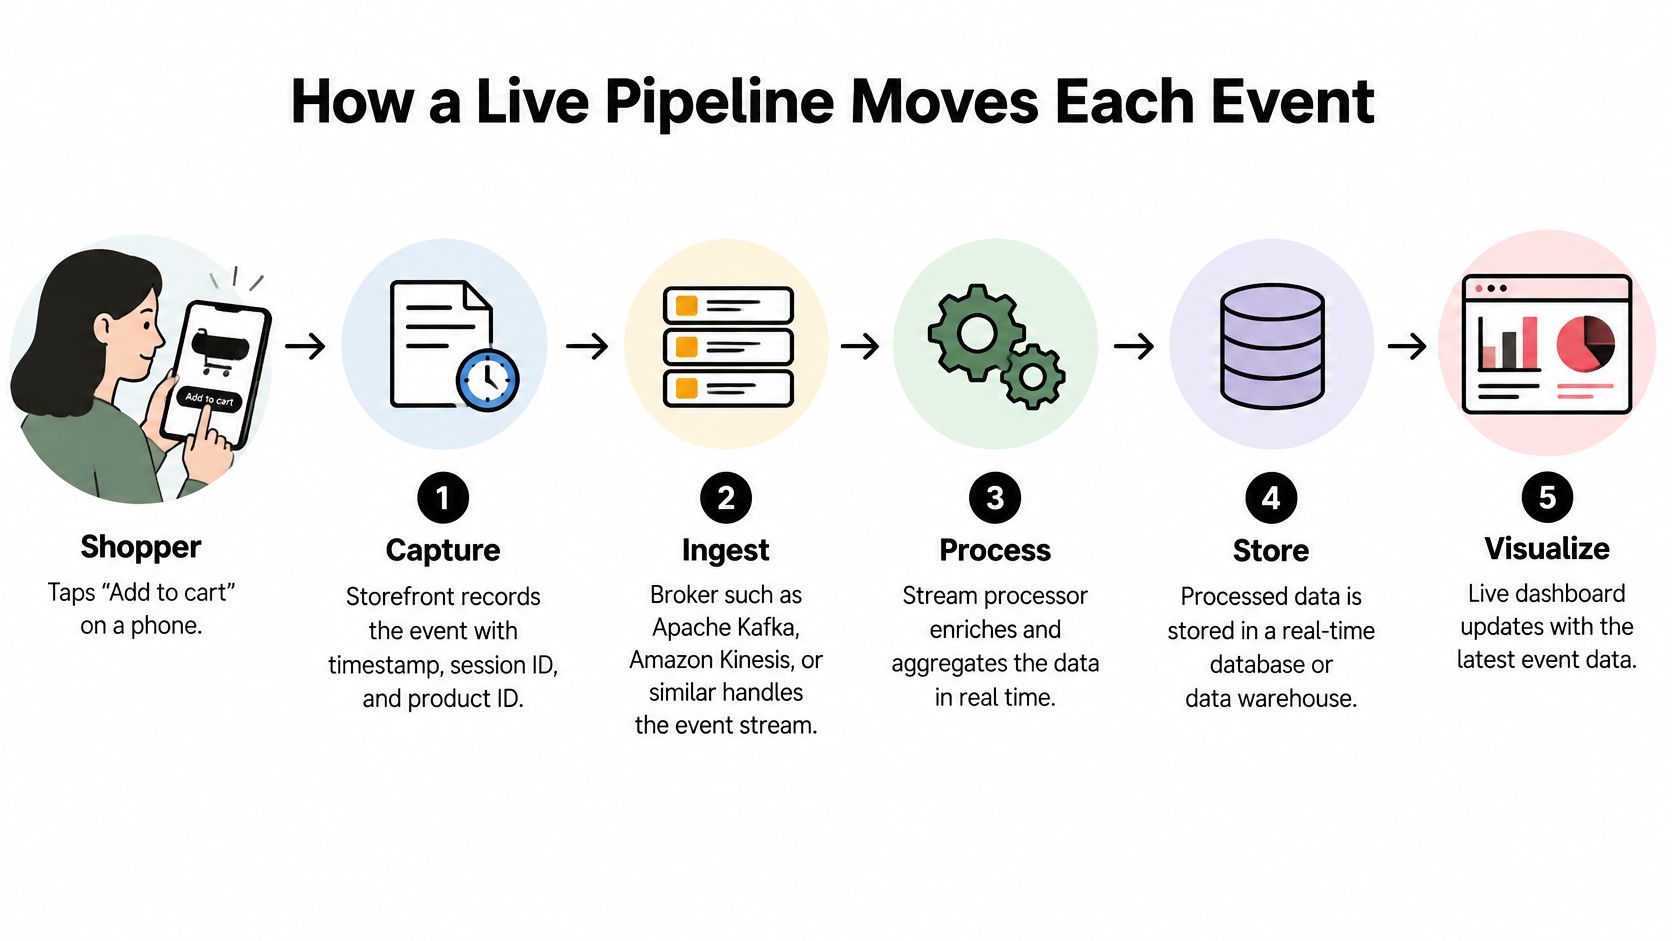
A shopper taps Add to cart. The button answers at once. The staff screen does not. Between those two moments the event has to be captured, interpreted, and delivered without changing what the shopper did. A shorter path only helps if the meaning survives. The shortest reliable path from the tap to a usable view beats a faster path that drops, duplicates, or reorders the action.
<a id="follow-the-event-from-storefront-to-screen"></a>
Follow the event from storefront to screen
The path works like a kitchen ticket. The order is written once, passed along, prepared, plated, and only then called out. Skipping a station to shout sooner is how the wrong dish reaches the pass.
- Capture the action. The storefront records a timestamp, session ID, product ID, and event ID. Keep the event ID stable during retries so downstream systems can recognize duplicates. Send the fields the live view needs, not a fuller copy of the shopper than the action requires.
- Ingest the event. A broker buffers incoming activity so processing does not depend on every downstream service being immediately available. Configure ordering around the entity that matters, such as a cart, rather than assuming a global event order.
- Process the meaning. A stream processor updates counts, enriches product details, or groups events into time windows. Preserve event time separately from arrival time so a delayed message does not become current activity.
- Store useful state. An analytical database or cache holds current totals and recent history. Keep the live query narrow rather than repeatedly scanning the entire event archive.
- Transport the change. WebSockets or Server-Sent Events carry updates to the browser. Include a recovery mechanism so reconnecting clients can retrieve missed changes instead of guessing.
- Render the difference. The browser changes the affected row, counter, or chart mark. It should not reload every session because a shopper removed one item.
A comparative rendering experiment published in DUJOPAS found lower rendering times and smoother updates with client-side Apache ECharts and Plotly.js than with the tested server-side Matplotlib and Bokeh approaches. Those results are benchmark-specific, so test your own event patterns and browsers rather than treating the library choice as a guarantee.
<a id="pipeline-stages-roles-and-failure-points"></a>
Pipeline stages, roles and failure points
| Stage | Role | Example tools | Failure to watch |
|---|---|---|---|
| Capture | Records the event with timestamp and IDs | Storefront script or app SDK | Missing or duplicated events |
| Ingest | Buffers events with configured ordering | Apache Kafka, Amazon Kinesis, Google Pub/Sub | Consumer lag during traffic peaks |
| Process | Counts and aggregates over time windows | Apache Flink, Spark Structured Streaming, ksqlDB | Late events landing in the wrong window |
| Store | Holds current and recent state | ClickHouse, Apache Druid, Redis | Slow queries over wide date ranges |
| Transport | Pushes updates to the browser | WebSockets, Server-Sent Events | Dropped connections and reconnect storms |
| Render | Draws only changed marks | Apache ECharts, Plotly.js | Dropped frames and freezing under sustained updates |
Send append-only events or field-level patches, not the complete session table on every change. A full-table rewrite can look live while it burns bandwidth and freezes the browser during a busy sale.
Replay realistic traffic while someone filters, scrolls, and opens carts. Use this real-time analytics platform guide when assessing the architecture. Before selecting tools, draw your own pipeline and mark where lag, dropped events, duplicates, and out-of-order arrivals could occur. A stage that cannot recover is not a shorter path. It is a place where staff act on a picture that is already wrong.
<a id="latency-budgets-for-each-interaction"></a>
Latency Budgets for Each Interaction
Continuous interactions need tighter feedback than discrete actions. The interactive database benchmarking paper identifies feedback below 100 milliseconds for continuous interactions and approximately 1 second for discrete actions. Dragging creates an expectation of uninterrupted motion; clicking a filter doesn't create that same expectation.
These are interaction budgets, not a demand that every incoming shopper event traverse your entire system at the fastest threshold. Separate event-to-screen freshness from action-to-feedback responsiveness when defining service targets.
<a id="latency-targets-by-interaction-type"></a>
Latency targets by interaction type
The interaction targets below follow that distinction. The historical-query row describes an illustrative asynchronous design, not a universal response-time requirement.
| Interaction | Latency target | Design choice |
|---|---|---|
| Dragging a time-range slider or brushing a chart | Under 100 ms | Client-side state and in-memory data |
| Scrubbing a cart activity timeline | Under 100 ms | Prefetched window with local filtering |
| Choosing a filter or opening a customer record | Up to about 1 s | Indexed query with appropriately refreshed cached results |
| Switching between dashboards | Up to about 1 s | Preloaded layouts and lazy chart data |
| Historical query over a long date range | Allow several seconds in an asynchronous design | Background job with a loading state |
Keep slider movement local whenever possible. Let the browser filter already-loaded points while the server prepares any additional detail, rather than making every pointer movement wait for a database round trip.
Opening a record is different. Query an indexed cart or session identifier, return only the necessary fields, and show a clear loading state if the request takes longer than expected.
A fast database response doesn't prove that a person received fast feedback.
Instrument capture, queueing, processing, querying, serialization, network delivery, and rendering. Use a shared trace identifier where practical, and distinguish the storefront's timestamp from server receipt time so clock differences don't masquerade as pipeline delays.
For a long-range analysis, isolate the work from the live feed. Staff should still be able to inspect current carts while a historical query runs. Reserve the strictest budget for interactions people drag or scrub, rather than imposing it on every analytical operation.
<a id="dashboard-patterns-that-keep-staff-focused"></a>
Dashboard Patterns That Keep Staff Focused
A dashboard can receive fresh information and still be difficult to use. If rows move under a support agent's pointer or counters flash constantly, the interface interrupts the person it's meant to help.
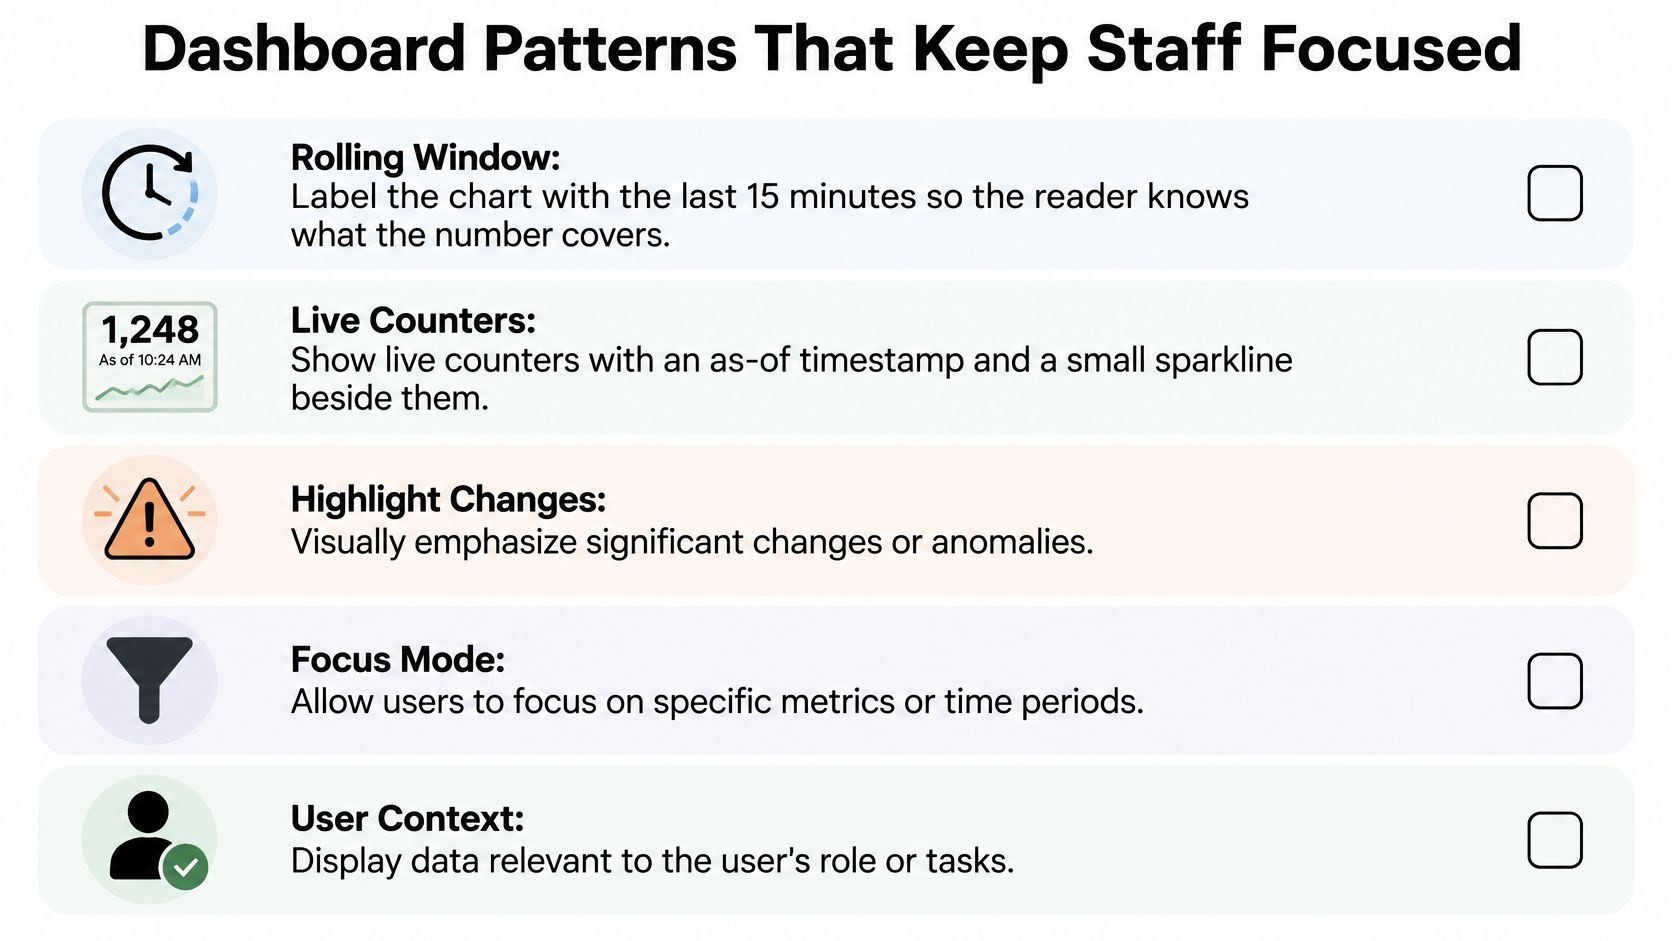
Start with a clearly labeled rolling window. A cart-addition count without a window could mean activity since the page opened, during the current shift, or across the entire store history. Staff shouldn't have to guess.
<a id="make-changes-readable"></a>
Make changes readable
Pair a live counter with an as-of timestamp and sparkline. The value answers how much, the timestamp establishes freshness, and the sparkline supplies direction without requiring another chart.
Highlight changed values briefly, then return them to their normal appearance. Coalesce incoming changes into scheduled browser repaints instead of rebuilding the interface for every message. Tune that cadence against readability and responsiveness in the browsers your staff use.
A feed needs stable navigation, too. Insert new entries consistently, provide a pause control, and preserve the selected row while someone reads it. A paused view should visibly say that it's paused.
Use analytics dashboard examples to compare layouts against the task, not just visual polish.
<a id="apply-this-afternoon-checklist"></a>
Apply this afternoon checklist
- Label the window. State what interval every chart and total covers.
- Show freshness. Put an as-of timestamp and compact trend beside live counters.
- Limit emphasis. Fade change highlights instead of leaving the screen permanently illuminated.
- Batch repaints. Coalesce updates without delaying interaction feedback.
- Protect reading. Keep feed order predictable and provide pause and resume controls.
- Stabilize axes. Hold the scale steady during inspection and flag values outside the displayed range.
- Expose missing data. Draw a gap for interrupted collection, not a line implying zero activity.
- Define active consistently. Reuse the same session-activity rule across panels.
Display the reporting time zone explicitly. Keep alert styling distinct from ordinary changes, and give each role a focused view so a support agent doesn't have to monitor every operational metric.
<a id="live-shopper-and-cart-feeds-in-practice"></a>
Live Shopper and Cart Feeds in Practice
Business outcomes provide a reason to investigate live analytics, but they aren't an ecommerce forecast. A 2022 study by KX and the Centre for Economics and Business Research surveyed more than 1,200 companies across six countries in manufacturing, automotive, finance and insurance, and telecommunications; 80% reported revenue increases and 98% reported increased customer satisfaction after implementing real-time analytics.
For a merchant, the practical question is narrower: what would someone do differently with a fresh shopper signal?
<a id="read-the-scene-before-changing-anything"></a>
Read the scene before changing anything
Say a campaign starts sending visitors to an outdated collection page. The live shopper feed shows the landing-page pattern, prompting the campaign owner to inspect the destination. The useful action is correcting the link, not merely watching the visitor counter rise.
A cart feed might show shoppers adding products, starting checkout, and then removing items. That sequence warrants checking shipping messages, availability, and price presentation. It doesn't establish that shipping cost caused abandonment.
Search activity creates another opportunity. Repeated zero-result searches for an alternate product name can justify reviewing catalog synonyms, while a source surge after an email send gives marketing a reason to test the tagged link.
In an assisted B2B workflow, an idle wholesale cart may prompt an account representative to offer ordering help. The representative should verify the account and understand the shopper's request before preparing a draft order.
<a id="live-ecommerce-use-cases-signals-and-actions"></a>
Live ecommerce use cases, signals and actions
| Use case | Live signal | Staff action | Watch for |
|---|---|---|---|
| Live shopper feed | Visitors, countries, landing pages | Redirect a campaign to a better page | Mistaking a short spike for a trend |
| Cart activity | Items added and removed, checkout started | Check shipping and price messages | Abandonment caused by stock problems |
| Zero-result searches | Search terms with no match | Add synonyms or a product page | One-off typos |
| Campaign traffic | UTM source surges | Confirm the link and pause if it's broken | Bot traffic |
| B2B assisted sale | Company name on an idle cart | Offer a draft order or invoice | Unverified company identity |
Behavior is evidence for investigation, not proof of motivation. A shopper may leave a cart because they're comparing products, waiting for approval, or interrupted.
Assign each use case an owner who can investigate and act. The study's figures describe reported outcomes among participating companies, not guaranteed results for an individual store.
<a id="when-live-data-should-trigger-action"></a>
When Live Data Should Trigger Action
Faster information doesn't automatically improve a decision. In a 2025 survey of 259 data managers discussed by DBTA, interest in real-time analytics as a standalone priority fell from 50% to 32% over two years, alongside greater interest in predictive insights and automated actions.
Monitoring and intervention are different commitments. Looking at a cart is observational. Contacting its shopper, displaying a prompt, or changing a campaign consumes attention and can affect the customer experience.
<a id="judge-the-signal-before-the-response"></a>
Judge the signal before the response
- Event recency. Is the shopper still present, or are you reacting to delayed activity?
- Shopper intent. A checkout start warrants different attention from a casual product view.
- Order value. Does the potential order justify staff time without creating an intrusive experience?
- Repeat behavior. Is this a recurring obstacle or an isolated action?
- Confidence. Is collection working, and does the evidence support the proposed conclusion?
Consider a high-value cart that becomes idle after checkout begins. A human review may be appropriate, especially if the shopper has requested help. The agent should check the context before sending a message rather than automatically assuming hesitation means a discount is needed.
A new visitor leaving a landing page is a weaker signal. Likewise, a sudden cluster of searches from a small group of sessions may justify watching the feed, but not rewriting the catalog immediately.
Intervention threshold: Match the strength of the action to the strength of the evidence.
An exit-intent prompt belongs in an eligible cart or checkout-adjacent context, not indiscriminately across every visit. Define suppression rules so a shopper isn't repeatedly interrupted after dismissing assistance.
Set staff capacity before enabling alerts. Assign an owner, group related events, and suppress duplicates while an investigation is open. Test rules against changed traffic patterns and broken integrations so yesterday's useful alert doesn't become today's noise.
Before converting any live alert into action, ask: Is it recent, does it indicate intent, and is the evidence sufficient?
<a id="privacy-and-trust-in-live-shopper-views"></a>
Privacy and Trust in Live Shopper Views
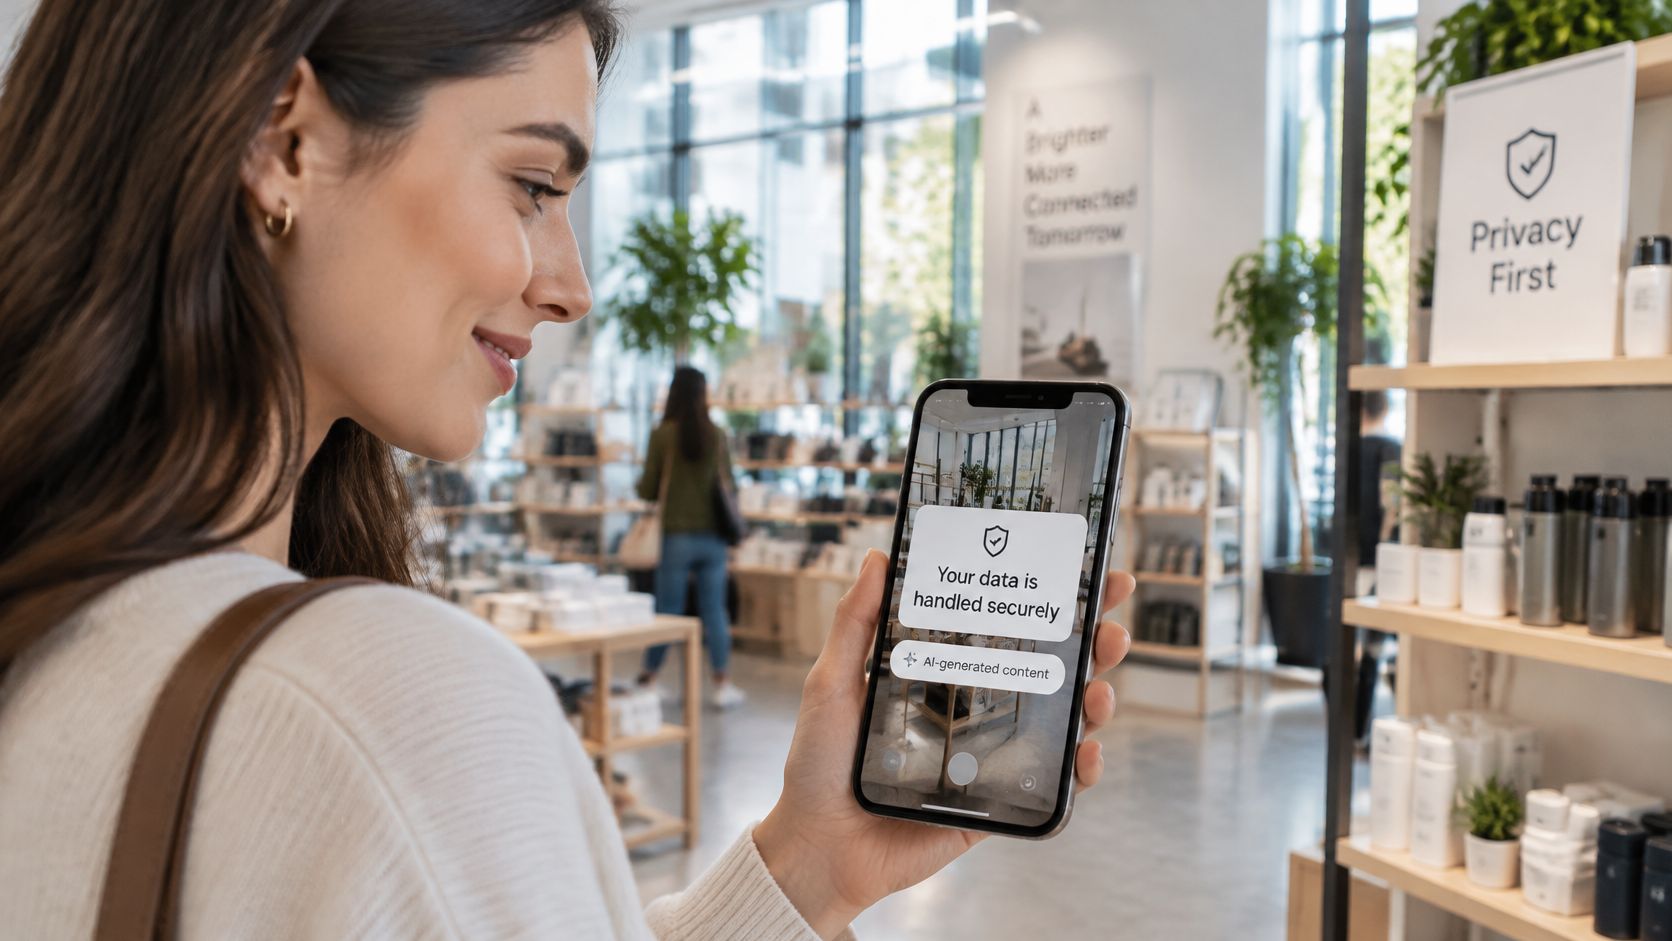
Shoppers expect useful service without unnecessary exposure. Adobe's 2025 retail research found that 87% of consumers expect retailers to handle personal data responsibly and securely, while 74% want clear disclosure when AI-generated content, recommendations, or images are used.
A live interface should therefore expose the information needed for a task, not everything the business can collect. More granular tracking isn't automatically more helpful, especially when staff can't explain how an identity was established or why an intervention occurred.
<a id="build-privacy-into-the-working-view"></a>
Build privacy into the working view
- Use task-level identifiers. Show a Cart ID in a shared support queue rather than an email address or full customer profile.
- Separate anonymous and authenticated activity. Don't present an inferred connection as a verified account relationship.
- Restrict access by role. Give support access to the cart details needed for assistance, and finance access to appropriate financial records rather than unrestricted browsing histories.
- Document retention. Set a deletion window for each data type and include exports in the policy.
- Record assisted actions. Log who offered a discount, created a draft order, or initiated customer contact, with the reason.
- Protect B2B account details. Show company names only to authorized account-handling roles, and distinguish verified account information from inferred identity.
- Expose uncertainty. Mark stale panels and unresolved identity matches so staff don't act on misleading certainty.
Review consent requirements and applicable regional privacy obligations before enabling collection in each market. Include shared screens, downloaded files, and staff access changes in that review, not just the storefront tracking script.
Use this data security and privacy compliance guide to structure the operational checks. Require human review before customer-facing intervention during the pilot, and make sure the reviewer can explain the reason for contact without exposing unnecessary behavioral details.
<a id="run-a-one-decision-pilot-this-week"></a>
Run a One-Decision Pilot This Week
Choose a decision where waiting plausibly costs an opportunity, such as helping an eligible shopper who becomes idle after starting checkout. Name the person responsible and write down what assistance they're allowed to offer.
Keep the pilot confined to a campaign or product line. Compare the timestamp of the shopper event with when today's reporting makes it visible, then record whether a live view would have changed the response.
<a id="keep-the-experiment-bounded"></a>
Keep the experiment bounded
- Choose delivery deliberately. Retain polling if it supports the decision; introduce streaming only when the action requires fresher information.
- Test the working screen. Scrub the timeline, open a related record, and run a historical query while the feed continues. Record visible delays and failures.
- Write the alert rule first. Define eligibility, required evidence, ownership, suppression, and the workload an agent can handle.
- Limit exposure. Share Cart IDs rather than unnecessary identity fields, and establish retention before inviting staff.
- Evaluate the action. Log whether someone intervened, why, and what happened. Don't mistake a moving dashboard for a successful pilot.
On Shopify, Cart Whisper | Live View Pro can supply the pilot with products viewed, added, and removed, while its Cart ID feature lets support open the customer's exact cart to help finish an order.
Keep streaming only if the observed reduction in delay changed a useful action. Otherwise, simplify the setup and retain the reporting cadence your team can reliably use.
Cart Whisper | Live View Pro offers real-time shopper and cart activity, including page visits, searches, and UTM sources, with Cart IDs that connect assistance to the exact cart. Visit Cart Whisper | Live View Pro to try a focused live-view pilot around a checkout decision your team can act on.