Consumer Behavior Data Analysis That Guides Action
The most popular cart advice is also the bluntest: email everyone who left, then judge the week by one recovery rate. That rate cannot tell you who was buying, who was saving, and who bounced because a fee or a payment option appeared too late. Consumer behavior data analysis is the habit of joining what a shopper did to one response you can defend: help, silence, or a draft order.
A storewide reminder looks busy and often trains the wrong people to ignore you. I would start with the cheapest fix that matches the sequence in front of you, not with a discount for every idle cart.
Table of Contents
- Metrics That Answer a Merchant Question
- Event Streams You Have to Join
- Methods Matched to the Decision
- How to Move from Raw Events to Action
- Pitfalls That Mislead the Read
- Abandoned Carts That Were Never a Sale
- Store Decisions the Sequence Should Change
- Act on One High-Intent Cart Today
<a id="metrics-that-answer-a-merchant-question"></a>
Metrics That Answer a Merchant Question
Consumer behavior data analysis joins observed actions to a merchant decision. It is not a larger dashboard. Pick the question first, then the number that can change what you do this week. A plain account of customer analytics is useful only when each metric has a job.
| Metric | How to calculate | Decision it supports | When it misleads |
|---|---|---|---|
| Session to add-to-cart | Sessions with an add divided by sessions | Whether products earn a cart | Inflated by bots or pure browsing |
| Stage abandonment | (Sessions entering minus sessions advancing) divided by sessions entering | Which step to fix first | Mixes saving, comparing and fee shock |
| Checkout abandonment | (Checkouts started minus orders) divided by checkouts started | Payment, shipping or trust friction | Hides a missing payment method |
| Value of exiting carts | Sum of exiting cart value divided by exiting carts | Which stalls deserve live help | A few large carts skew the average |
| Cohort repeat rate | Buyers from a start week who buy again by week N, divided by that cohort | Whether acquisition quality holds | A short window flatters subscriptions |
| RFM priority band | Bins for recency, frequency and monetary value | Who to contact now | Stale if the natural repurchase cycle is long |
<a id="one-stage-then-one-split"></a>
One stage, then one split
Stage abandonment is sessions entering a stage minus sessions reaching the next stage, divided by sessions entering that stage. Run it on product view to add, add to checkout, and checkout to order before you touch creative.
Baymard's checkout benchmark puts average cart abandonment at 70.19%, drawn from 272 moderated usability sessions, eye-tracking, more than 850 benchmarked checkout steps, and nine studies with 11,777 participants. Treat that figure as a scale check, not a target. The average mixes wishlist use, comparison, fee shock, and real friction, so it cannot pick an intervention.
Practical rule: Choose one stage and one split, such as mobile versus desktop, source, or new versus returning, before you add another metric.
Checkout abandonment hides a missing payment method if you never split by the last step. Value of exiting carts tells you which stalls deserve a person, unless two wholesale carts pull the mean up. Cohort repeat rate and an RFM priority band answer later questions: did this acquisition week come back, and who is worth a touch now. Neither replaces the stage rate.
<a id="event-streams-you-have-to-join"></a>
Event Streams You Have to Join
A page view, a search, a cart edit, and an order are each incomplete. A history of consumer measurement traces the same idea from Nielsen, founded in 1923, which paired media exposure with purchase panels, through formal tests of data fusion by 1989, when separate datasets were combined to stand in for a larger survey.
Say a shopper lands from a paid social ad, searches a size, adds two units, removes one, and leaves on shipping. The order report shows nothing. The ad report shows a click. Only the joined session explains the stall.
You can collect four families of fields:
- On-site events: product views, search terms, add and remove, and the checkout step reached.
- Context: device, new or returning, UTM source, and geography.
- Identity, when consented: login and, for wholesale, the company name.
- Outcome: order, draft order, or exit, with the cart value at exit.
No single event stream is enough. A page view, a cart addition, or a purchase cannot explain the journey on its own.
<a id="what-you-may-not-infer"></a>
What you may not infer
Do not infer sensitive traits from clicks. Keep any automated read of a session transparent enough that a teammate can say which events produced the label. Shoppers already hesitate when software makes choices they cannot see, so the interpretation should stay as checkable as the event log. Anonymous sessions stay in their own group. A login is a fact the shopper gave you, not a license to guess income, health, or household.
Before you query, prepare the fields so they can be joined. The minimum join for tomorrow's read is session, last product interaction, cart changes, checkout step, and source. If one of those five is missing, you are back to a single stream and a guess.
<a id="methods-matched-to-the-decision"></a>
Methods Matched to the Decision
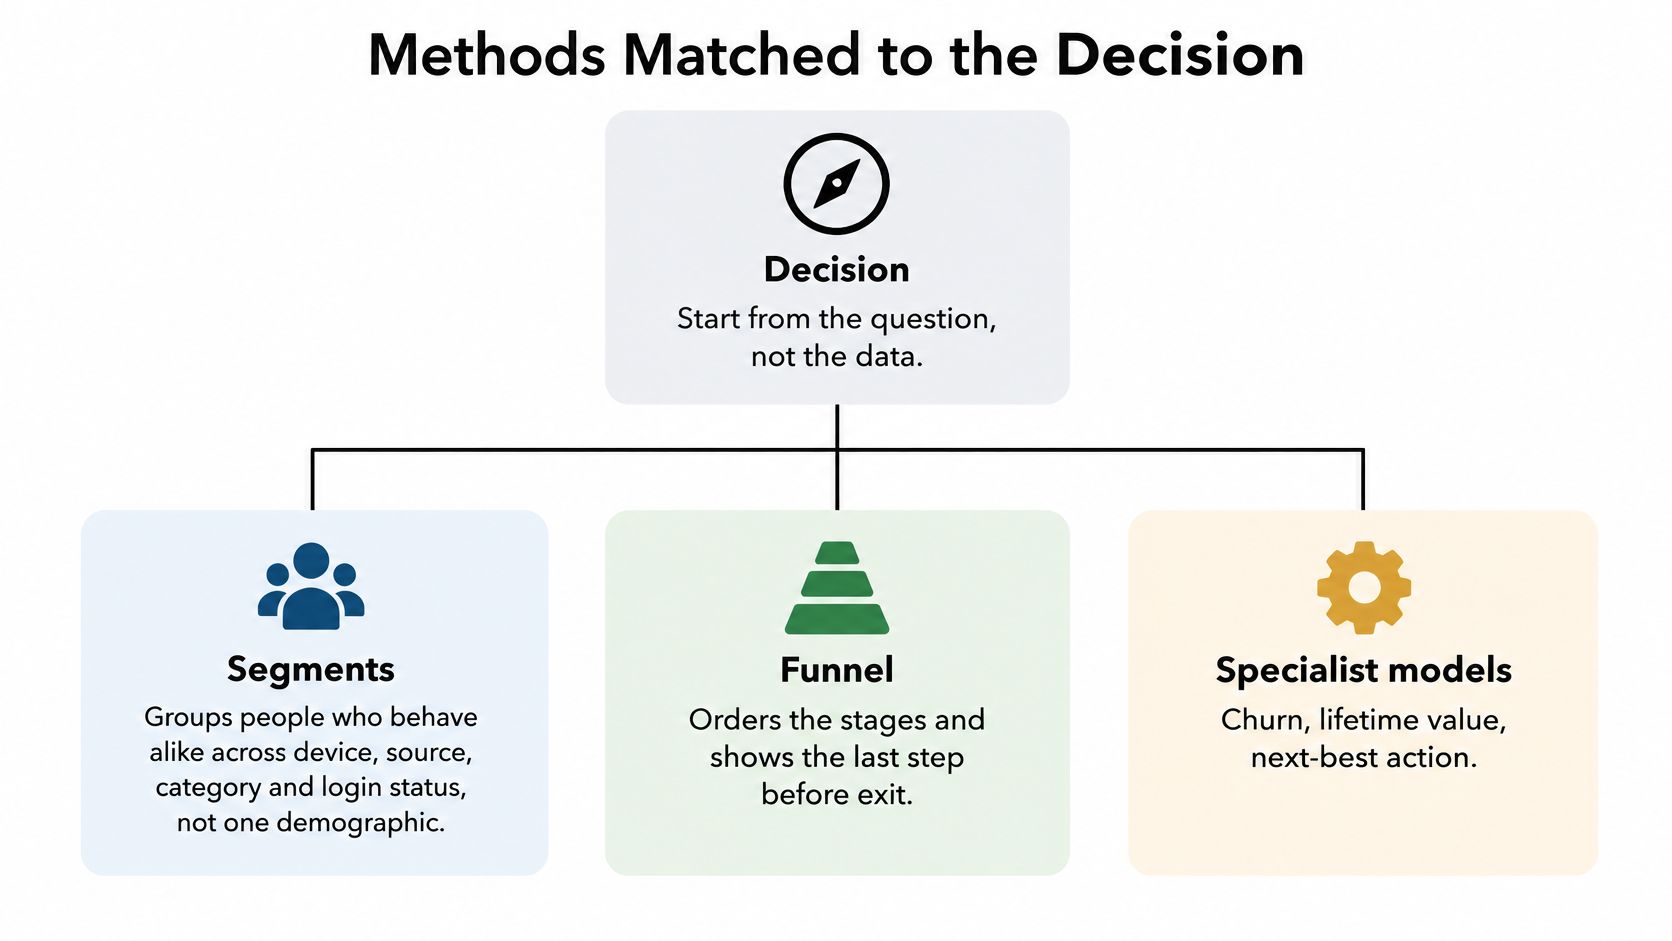
Start from the question. Description tells you what happened. Diagnosis tells you where it broke. A prediction only ranks who looks like past buyers. Work that became more quantitative from the late 1950s, and that had the Journal of Consumer Research by 1974, pushed segmentation past one demographic and separated a correlation from a structured account of choice. The store version of that lesson is simple: match the method to the decision, and read the difference between describing a funnel and predicting a session before you trust a score.
| Method | Question it answers | Minimum inputs | Output you can act on |
|---|---|---|---|
| Segmentation | Who behaves alike | Device, source, login, category | Named groups with different plays |
| Funnel | Where they stop | Ordered stage events | Stage rate and last step |
| Cohort | Did this group return | Start date plus later purchases | Retention by start week |
| RFM | Who deserves a touch now | Order dates and values | Priority bands |
| Predictive score | Which open session looks like past buyers | Historical sequences and outcomes | A ranked queue, not a guarantee |
<a id="a-miniature-you-can-check-by-hand"></a>
A miniature you can check by hand
Say a normal fortnight produces 1,000 sessions, 180 adds, 70 checkout starts, and 30 orders. Products are earning carts, since 180 of 1,000 sessions added something. Of the 180 adders, 150 never ordered. That is not one problem.
Segmentation splits those 180 by device, source, category, and login. Mobile paid traffic that adds and dies is a different group from returning desktop buyers.
Funnel orders the stages. Forty people started checkout and never ordered. Only that forty can be fee-shock candidates, and only if the last step was shipping or tax. The 110 who added and never opened checkout are not a shipping bug.
Cohort fixes a start week, first purchase or first add, and asks who came back. A strong week of first orders that never repeats is an acquisition-quality problem, not a checkout problem.
RFM bins recency, frequency, and spend so the team knows who is worth a touch now. A lapsed high-spender outranks a one-time small order.
A predictive score then ranks open sessions by similarity to past converters. It is a queue for a person, not a promise that this session will buy. Do not run that model until the funnel split is stable. If mobile shipping abandonment jumps around every week, the model will learn noise.
<a id="how-to-move-from-raw-events-to-action"></a>
How to Move from Raw Events to Action
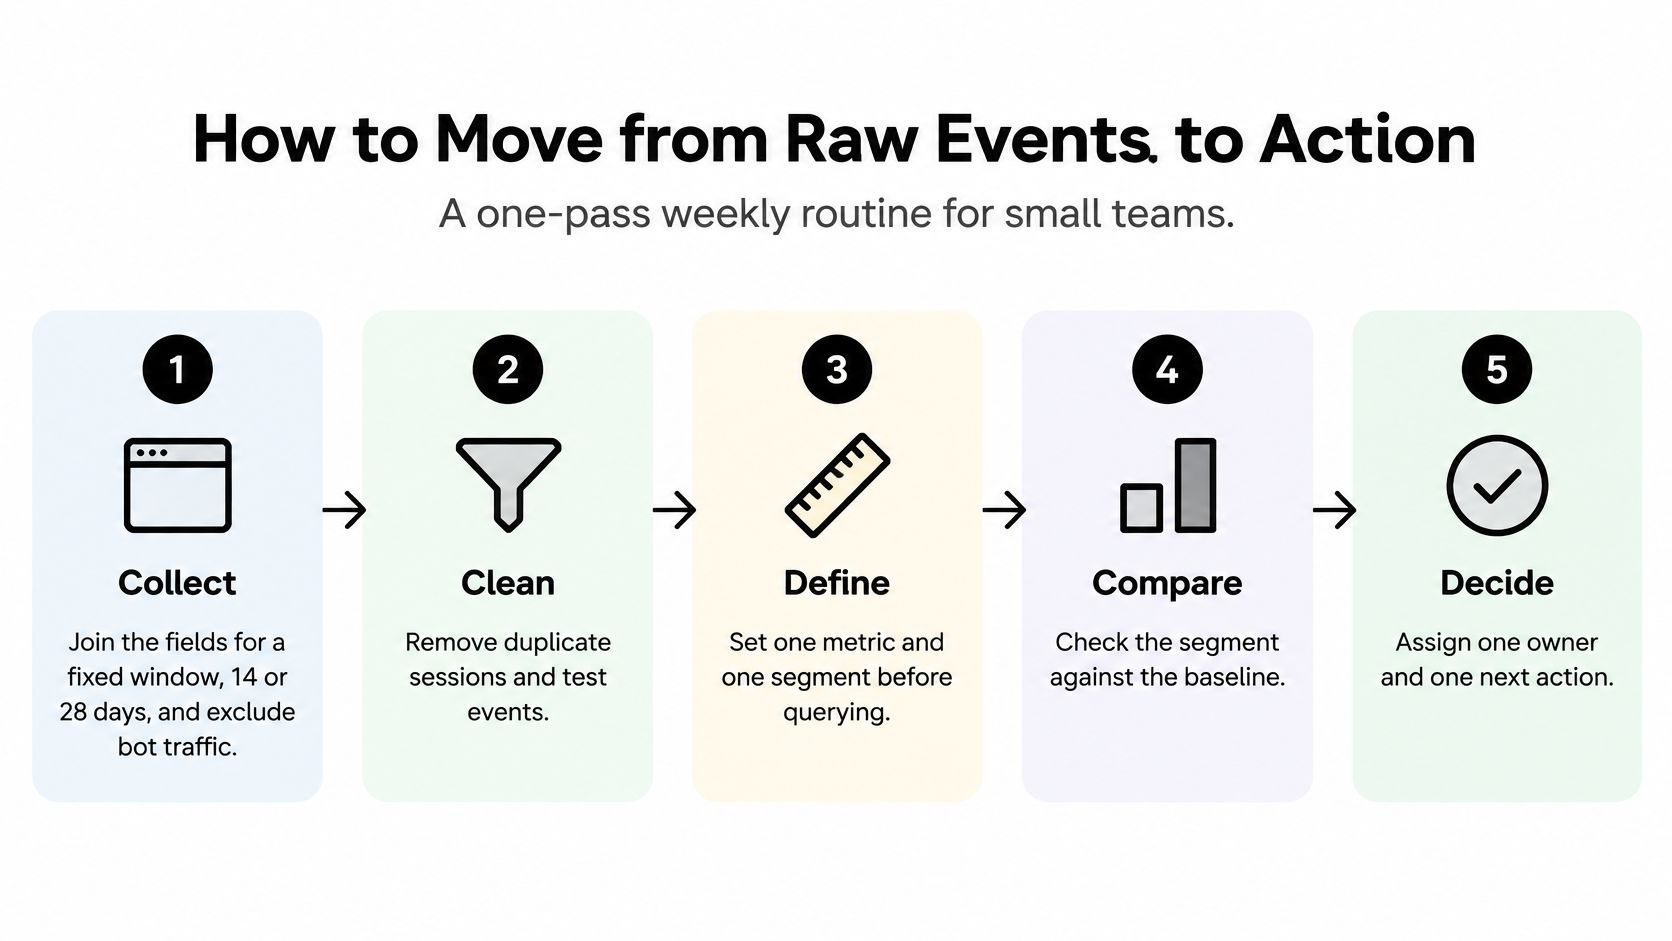
A small team can run one pass this week. Six moves, each with a reason and a slip that ruins it.
- Collect a fixed window. Pull session, last product interaction, cart changes, checkout step, and source for 14 or 28 days, and exclude bot traffic. A rolling "last 30 days" that changes every morning makes the before and after incomparable.
- Clean without deleting the signal. Drop duplicate sessions, sessions of a few seconds, and carts with impossible quantities. Keep removals. A remove is a decision, not noise. The slip is filtering to completed orders and calling the remainder "engaged."
- Integrate identity only where it exists. Logged-in shoppers and company accounts can carry a name. Anonymous sessions stay in their own cohort. Merging them on a guessed email invents a customer.
- Write the hypothesis before the chart. Use one funnel split and one method. "Mobile sessions die on shipping more than desktop" is a hypothesis. "Let's see what the data says" is a tour.
- Act once. Fix that step, offer help on high-value idle carts, suppress a reminder, or turn a wholesale cart into a draft order. Two changes in one window leave you unable to say which one moved the rate.
- Re-measure the same stage on the next equal window before a second change. If the rate does not move, the hypothesis was wrong. That is a result.
<a id="two-windows-that-lie"></a>
Two windows that lie
A sale week is not a baseline. Traffic mix, discount depth, and patience all shift, so a "win" against a normal week is often the promotion. Hold the comparison to the same kind of calendar.
A B2B cart that sits for days is often a workspace. The buyer is building a quote, waiting on a colleague, or checking a ship-to. Marking it failed at hour 24 will push a consumer coupon into a purchasing process.
Save one artifact: hypothesis, split, stage rate before, action, stage rate after. If you cannot fill those five lines, you did not run an analysis. You browsed a report.
<a id="pitfalls-that-mislead-the-read"></a>
Pitfalls That Mislead the Read
- Treating a published average as a target. That blended rate mixes wishlist use, comparison, fee shock, and real friction. A store at a lower number is not automatically healthy, and a store above it may be full of deliberate saves.
- Counting bots and pure browsing in add-to-cart. The top of the funnel looks fine, and a broken checkout stays hidden. Filter non-human traffic before you judge the product page.
- Comparing a sale week with a normal week. Use the same kind of calendar before and after. Otherwise the promotion gets credit for the stage rate.
- Building cohorts only from buyers. Shoppers who never reached the cart drop out of view, and the repeat rate looks kinder than the acquisition really is.
- Reading a survey line as behavior. "Shipping costs too much" is a hypothesis. Check it against exits on the shipping step. If people leave earlier, the fee is not the cause.
- Trusting a score trained on one traffic mix. It ranks sessions. It does not forecast them, and it drifts when campaigns change. Recheck the ranking after a new source comes online.
- Changing two things in one window. You then cannot tell which change moved the stage rate.
Each pitfall has a check: a stable split, an equal window, a consented survey, or a holdout group before the next change. Skip the check and the chart will agree with whatever you hoped.
<a id="abandoned-carts-that-were-never-a-sale"></a>
Abandoned Carts That Were Never a Sale
Every exit is not lost revenue. In the United States, eMarketer's read of cart reminders finds that 33% of shoppers say they use carts as temporary wishlists or bookmarks. 51% say a reminder would have no effect, and 17% say a reminder would make them less likely to return. Only 32% say a reminder would raise the chance of purchase, though that rises to 49% among frequent abandoners.
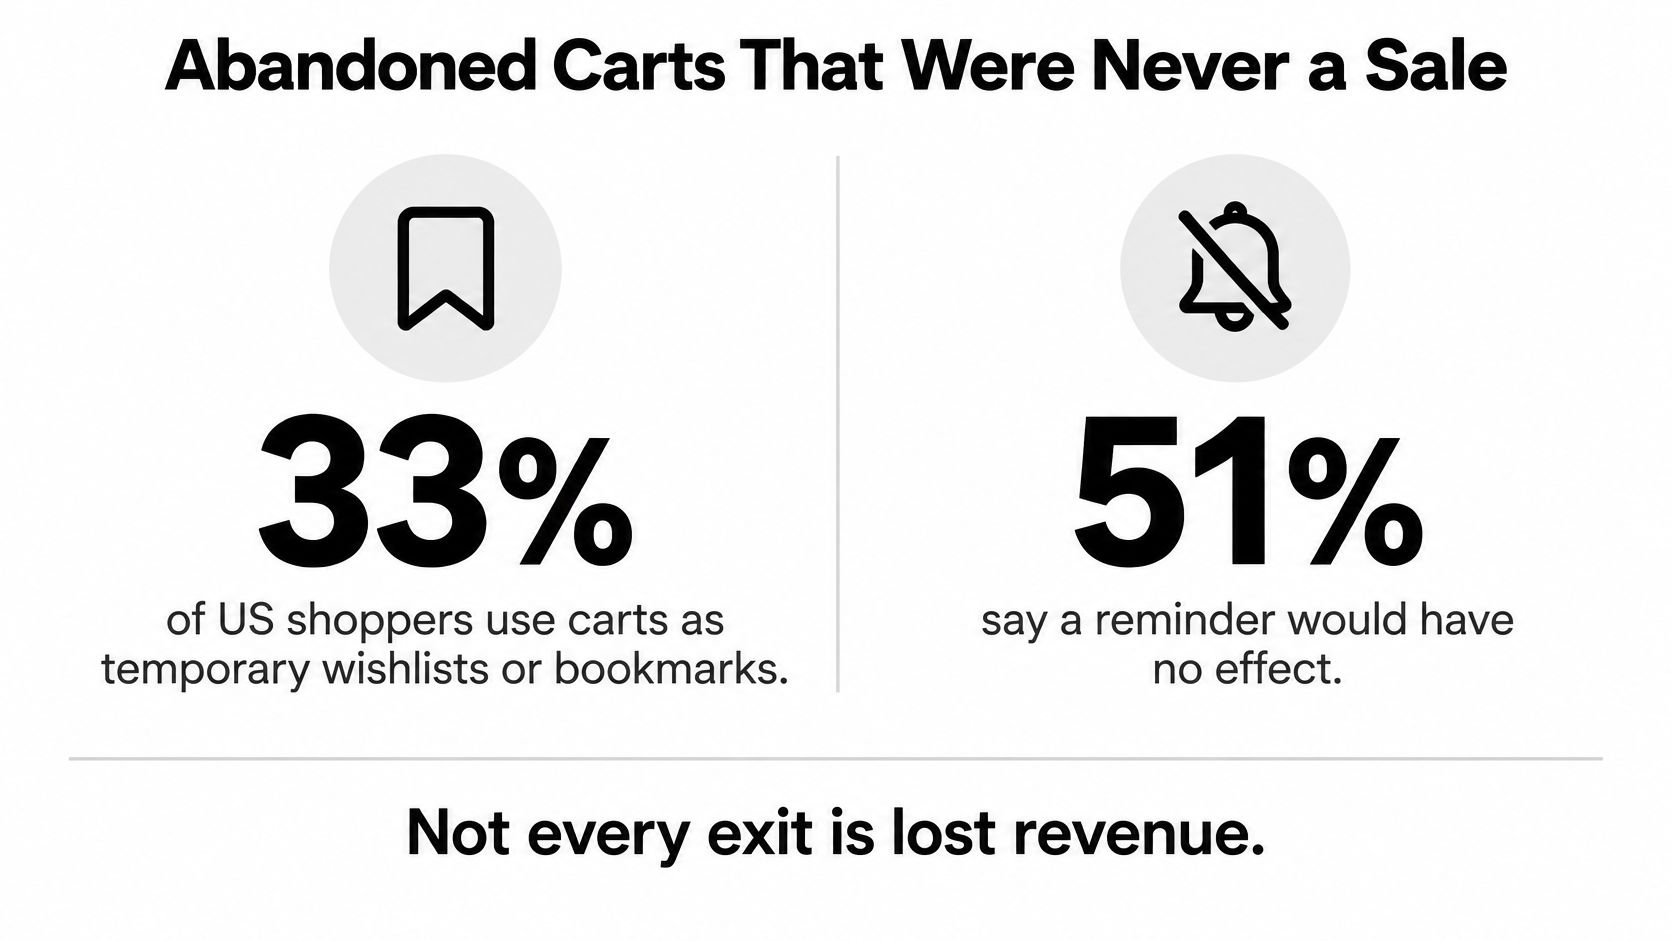
More aggressive recovery is not automatically better. Match the sequence, then pick help, silence, or a draft order.
| Behavior | Observable sequence | Fitting response | Avoid |
|---|---|---|---|
| Wishlist or bookmark | Add, no checkout, later return, no fee page | Save the list; one light reminder | A discount blast |
| Comparison shopping | Many product views, cart edits, short stay | Clarify differences | Fake urgency |
| Fee shock | Reaches shipping or tax, then exits | Show total cost earlier | A generic recovery email |
| High-intent stall | Repeat views, add, stop at payment | Live help or another payment option | Ignoring it because the average looks normal |
| B2B quote building | Logged-in company, large cart, long idle | Draft order or volume price | Treating it as a consumer abandon |
<a id="what-to-refuse"></a>
What to refuse
A wishlist sequence wants silence or one light note, not a code. Comparison shopping wants a clearer difference between the products they opened, not a countdown timer. Fee shock wants the total earlier on the product page or cart, because the email arrives after the surprise. A high-intent stall, repeat views plus an add plus a stop on payment, is the sequence worth a person.
A missing preferred payment method is a separate failure. The shopper may have been ready to pay and left because the option was not there. A coupon does not replace that option, and a dashboard that only ranks the exit step will not name the expectation you missed.
Validate a segment with a short consented survey before you scale messages. Suppress reminders when the sequence looks like saving or comparing. On a wholesale store, a long idle cart from a logged-in company is a quote workspace. The fitting move is a draft order or a volume price, not a consumer abandon flow.
<a id="store-decisions-the-sequence-should-change"></a>
Store Decisions the Sequence Should Change
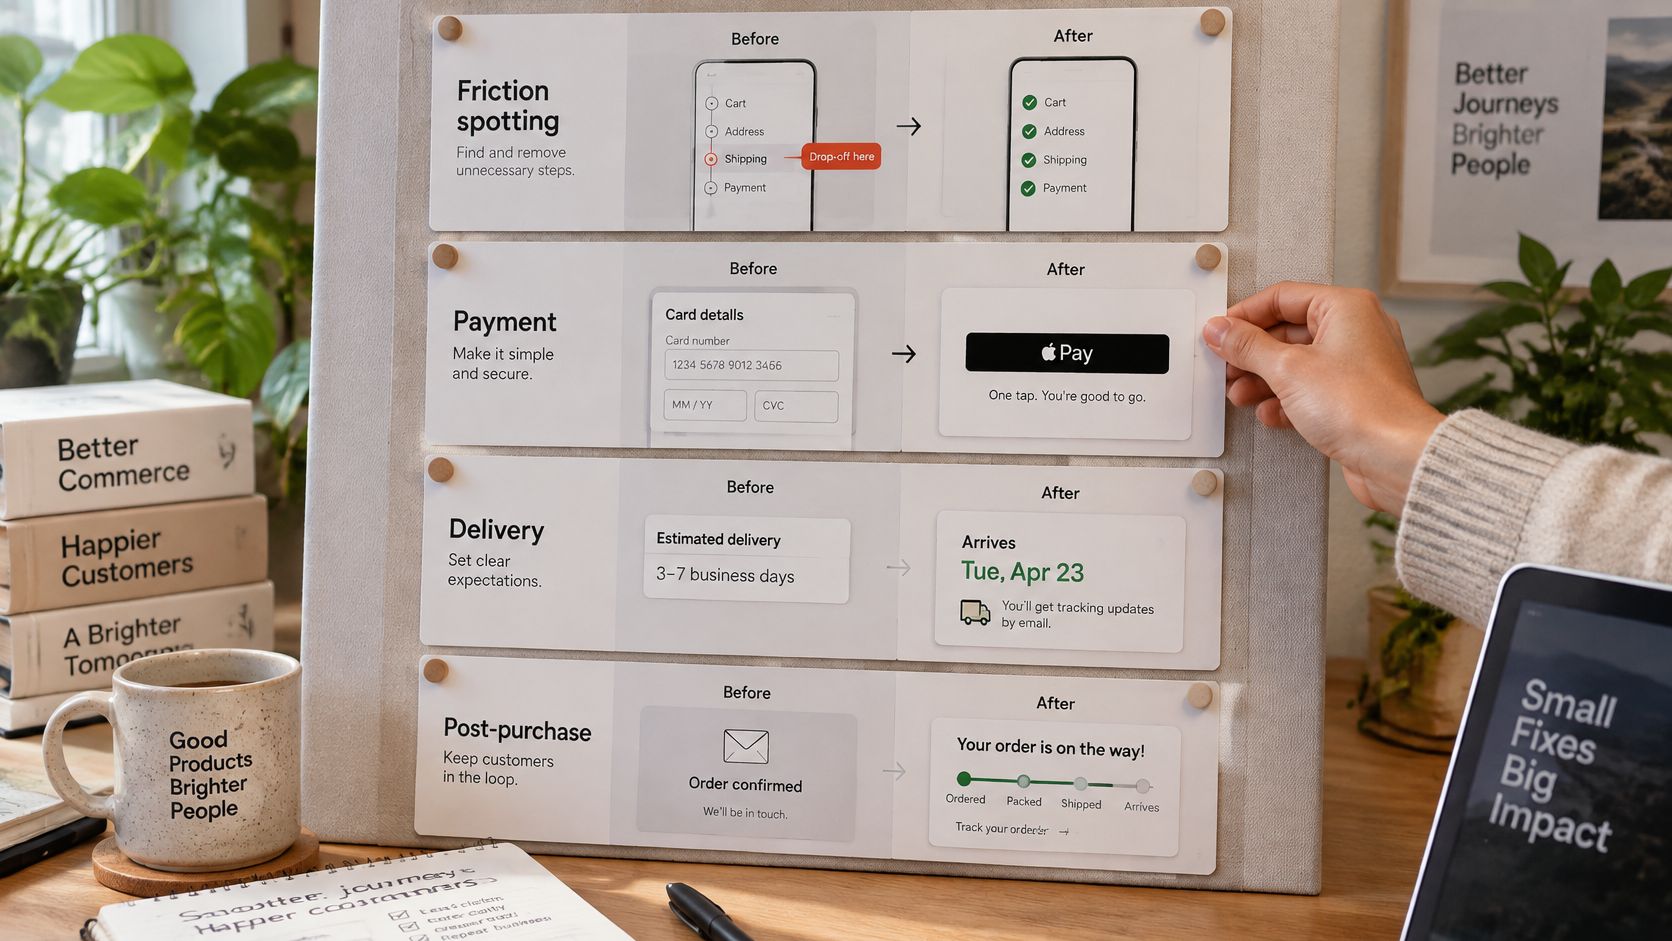
The sequence should change the job, not decorate a report. DHL's 2026 ecommerce trends research across 29 countries found that 62% of shoppers would abandon immediately if a preferred payment method were unavailable, while only 45% of businesses named payment availability as a major driver. That 17-percentage-point gap is what a funnel exit looks like when the merchant is answering a different question than the shopper.
<a id="four-jobs-each-with-a-before-and-after"></a>
Four jobs, each with a before and after
Friction spotting. Before: mobile conversion is "low," so the team rewrites product pages. After: mobile sessions die on shipping and desktop does not, so the fix is that step, on that device. The product page was never the leak.
Cart recovery. Before: every abandon gets the same three emails. After: only the high-intent stall is messaged. Wishlist behavior stays quiet, because a large share of shoppers say a reminder does nothing or makes a return less likely. The recovery rate may fall while completed orders from real stalls rise. Judge the stage, not the send volume.
Personalization. Before: the theme hides payment buttons to feature a recommendation. After: recommendations use what was viewed and what was removed, and the payment methods people expect stay visible. A missing option beats a clever offer. The same reporting should split abandonment by payment method, geography, device, customer status, traffic source, and checkout step, then test whether live help or clearer information closes the gap without a discount.
B2B workflows. Before: a logged-in company with a large idle cart gets a consumer coupon. After: that cart becomes a draft order, or a price that reflects volume or ship-to location. The buyer was assembling a quote. A 10% code talks past the decision they are making.
Pick the one job that matches your noisiest segment this week. If two segments shout, fix the one with the higher exiting cart value and a single, stable last step. Leave the second segment on the list until the first stage rate has an equal-window after.
<a id="act-on-one-high-intent-cart-today"></a>
Act on One High-Intent Cart Today
Open today's live activity and find one cart that matches a high-intent stall: repeated product views, an add, and a stop on shipping or payment, with a value worth a person's time.
Do three things only.
- Confirm the last checkout step and the device. If you cannot name both, you do not yet know what to say.
- Offer the missing fact. Shipping cost, a delivery date, or another payment method beats a blanket discount.
- If the cart belongs to a logged-in company, make a draft order instead of sending a consumer reminder.
Record the stage rate before you act. Cart Whisper | Live View Pro is built for this pass. It shows which products are viewed, added, or removed and where a shopper stops, gives each abandoned cart a unique Cart ID so you can open that session, and can turn carts into draft orders. Run it on one busy afternoon, then re-measure that stage on the next equal window before a second change.
Cart Whisper | Live View Pro shows live cart activity, the products shoppers view, add, or remove, and the step where they hesitate, so a high-intent stall gets help, silence, or a draft order instead of a blanket reminder. If you want that read on a Shopify store, visit Cart Whisper | Live View Pro and try one afternoon against a single stage rate.