
Real Time Analytics with Kafka for Ecommerce Teams
A shopper adds to cart, stalls on shipping, then disappears. A batch report will tell you about it tomorrow. An event stream tells you while you can still do something.
Real Time Analytics with Kafka turns those shopper actions into durable events the second they happen, so dashboards, alerts, and campaigns can react in the moment.
Table of Contents
- Why Real Time Analytics With Kafka Changes The Game
- Turn Events Into Immediate Decisions
- Choose The Right Response Path
- Organize Events With Topics and Partitions
- Let Independent Consumers Work Differently
- Connect External Systems With Kafka Connect
- Protect Consumers With Schema Management
- Choose the Right Stream Processing Tool
- Begin With Stateless Enrichment
- Choose The Right Window
- Follow The Shopper
- Flag Idle High-Value Carts
- Preserve State And Handle Late Events
- Check The Design Before Launching
- Choose Partitions as Parallel Lanes
- Set Latency by Business Decision
- Balance Retention and Replay
- Apply the Numbers to Merchant Scale
- Build a Practical Capacity Plan
- Watch Consumer Lag First
- Combine Broker and Application Signals
- Separate Operations From Analytics
- Diagnose Common Failure Patterns
- Measure Business Outcomes
- Build a Live Cart-Recovery Pipeline
- Build a Journey-Analytics Pipeline
- Compare the Two Pipelines
- Does a Small Shopify Store Need Kafka?
- How Does Kafka Differ From RabbitMQ for Analytics?
- What Happens if a Consumer Crashes Mid-Processing?
- Can Kafka Feed Machine Learning Models?
<a id="why-real-time-analytics-with-kafka-changes-the-game"></a>
Why Real Time Analytics With Kafka Changes The Game
Kafka doesn't just forward a message to one place and forget it. It keeps an ordered, replayable record of everything that happened.
That means your live dashboard can read cart events, while fraud checks, recovery tools, and warehouse pipelines all read those same events at their own pace. One stream becomes a shared record of what customers actually did.
It's a different model from batch. Batch is the morning newspaper, arriving on schedule. Kafka is more like a newsroom wire, updating as the story unfolds. Built at LinkedIn around 2010 and open-sourced in January 2011, it was designed for exactly this job of moving data between systems.
| Event | Immediate Decision Enabled |
|---|---|
| Page view | Highlight popular products and detect broken navigation |
| Search | Adjust search results and landing content |
| Cart addition | Trigger assistance or a recovery offer |
| Checkout start | Alert support to remove checkout friction |
| Purchase | Update dashboards and attribution |
<a id="turn-events-into-immediate-decisions"></a>
Turn Events Into Immediate Decisions
The real question isn't "is my dashboard live?" It's "can I act before the moment is gone?"
A cart addition can trigger a helpful nudge. A stalled high-value cart can ping support. A dead-end search can flag content that needs fixing. All from the same stream, just used differently.
<a id="choose-the-right-response-path"></a>
Choose The Right Response Path
- Dashboards show traffic, behavior, and revenue shifts while sessions are still active.
- Alerts get support or sales in front of a good shopper before they leave.
- Recovery campaigns fire right away, no waiting on a nightly export.
- Historical stores take in the same events for funnel and cohort work later.
The event log is the shared source of truth; each consumer chooses its own pace and destination.
Cart Whisper | Live View Pro makes that endpoint concrete, with live visitors, page views, searches, UTM sources, devices, and cart changes in one view. Explore real-time data visibility to see what that workflow looks like for merchants.
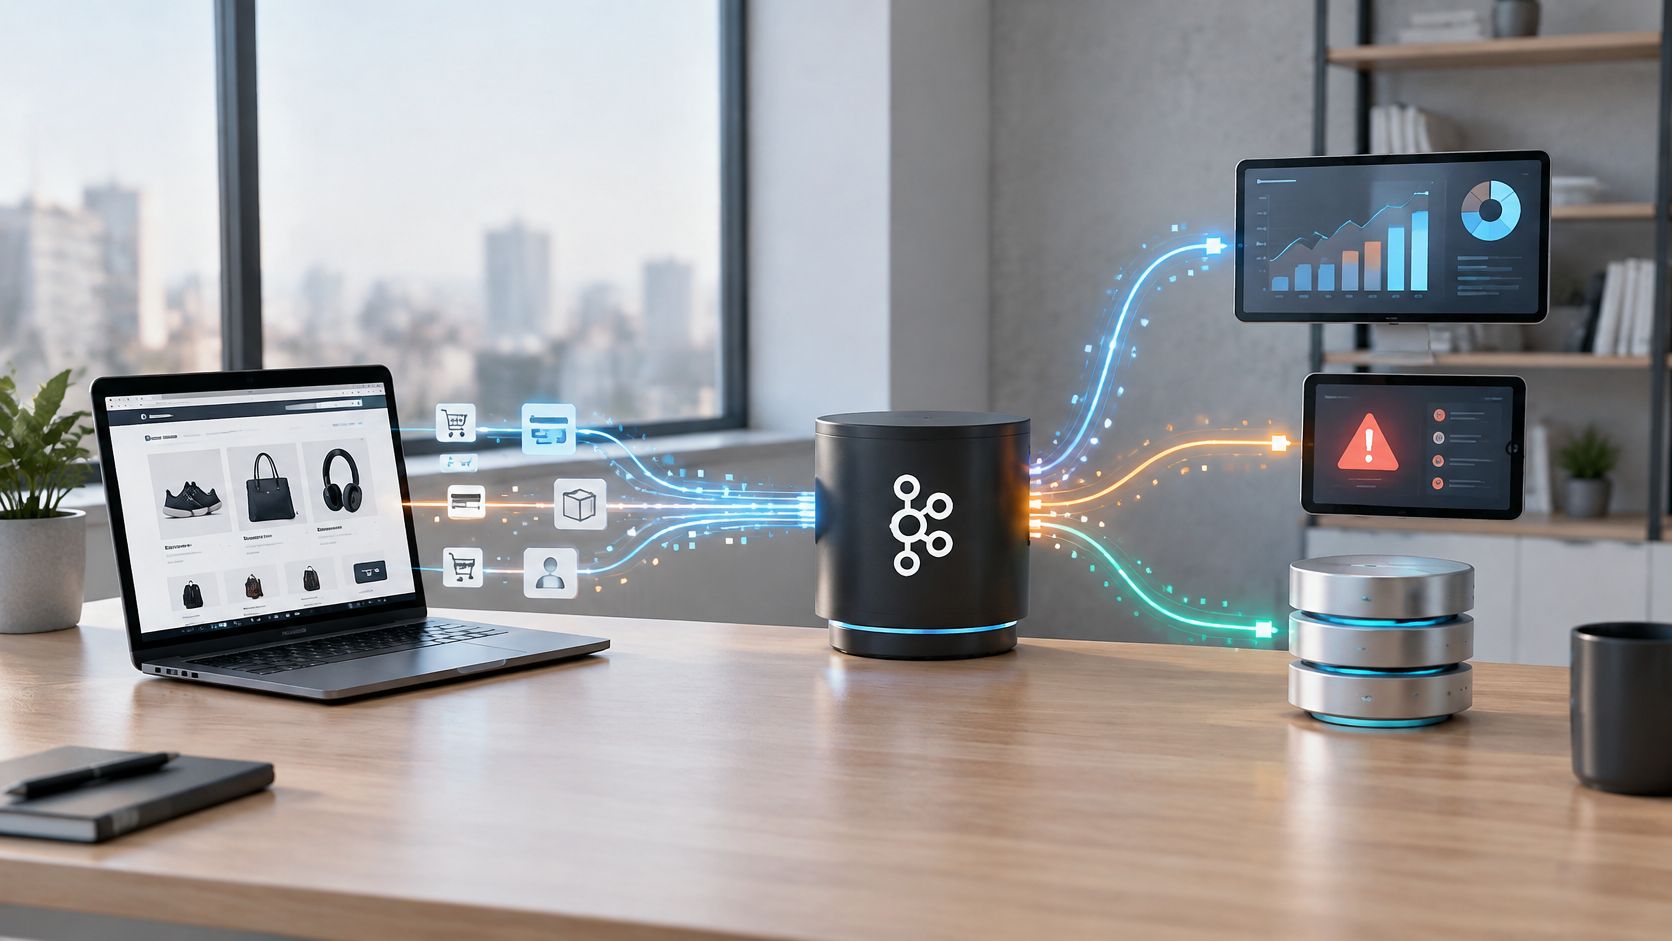
A real-time pipeline starts with producers. These publish storefront actions the moment they happen.
Page views, searches, cart adds, removals, checkout starts — they become durable events, not just one-off database writes.
<a id="organize-events-with-topics-and-partitions"></a>
Organize Events With Topics and Partitions
Think of each event type getting its own topic. Inside a topic, Kafka splits the log into partitions.
Partitions are like highway lanes. Each lane keeps its own order, but all lanes move at the same time.
For cart events, use a consistent key like cart_id. That way adds and removes for the same cart stay in sequence, even with thousands of shoppers active at once.
That same partitioning powers parallelism for real-time analytics with Kafka. More partitions means more distributed work — but key choice and capacity planning really matter here.
The Kafka log is the source of truth, not any downstream database. Dashboards, alerts, and warehouses are just replayable views of those events.
<a id="let-independent-consumers-work-differently"></a>
Let Independent Consumers Work Differently
A consumer group is a set of consumers sharing the read work for a topic. And different groups can read the same events independently.
It's like separate departments reading the same company wire:
- Marketing tracks campaign conversions
- Fraud looks for odd checkout behavior
- Warehouse builds historical records
Each group tracks its own offset. So one team's pace never slows down another.
That isolation is what keeps a slow dashboard query from blocking a cart-recovery alert. It also lets you replay after fixing a transform or adding a new use case.
<a id="connect-external-systems-with-kafka-connect"></a>
Connect External Systems With Kafka Connect
Kafka Connect handles the plumbing between Kafka and everything else. No custom glue code needed.
- Source connectors bring records into Kafka
- Sink connectors write processed records out
In ecommerce, that might look like a database change connector capturing new orders into an orders topic. Then a sink connector copies those events to a warehouse or search index.
Connectors save a lot of work, but you still have to watch for failures and schema drift. Microsoft's Fabric Eventstream connector guidance is a good example of how managed connectors bridge streaming and analytics systems.
<a id="protect-consumers-with-schema-management"></a>
Protect Consumers With Schema Management
Say five teams all consume the same add-to-cart event. Everyone expects fields like event_id, cart_id, customer_id, product_id, quantity, event_time, and source.
Schema management is what keeps that agreement intact. If a producer suddenly drops quantity, a basic pipeline breaks. Worse, a sloppy one keeps running and miscalculates cart totals.
Versioned schemas, compatibility rules, and producer-side validation turn that silent bug into a visible deploy issue. Kafka's official docs cover the core producer, consumer, and connector settings to enforce this.
<a id="choose-the-right-stream-processing-tool"></a>
Choose the Right Stream Processing Tool
| Processing Option | Best Fit | Query and State Needs | Deployment Model |
|---|---|---|---|
| Kafka Streams | Java teams building event-driven services | Rich transformations, joins, and local state | Embedded library inside an application |
| ksqlDB | Teams comfortable with SQL | Streaming filters, aggregations, and windowed queries | Separate managed or self-hosted service |
| Apache Flink | Specialized real-time processing teams | Complex state, advanced joins, and custom jobs | Independent distributed runtime |
Pick based on team skills, query complexity, and who owns operations — not just speed benchmarks.
Kafka Streams fits well if you already run a Java service. ksqlDB lowers the bar for SQL-first teams. Apache Flink handles deeper state and trickier stream logic, but you take on another runtime.
If you're mapping out the bigger picture, this overview of real-time analytics architecture shows how streaming, storage, and API layers fit together.
Start small: one event family, one topic, one consumer that drives a real action. Add connectors, governed schemas, and heavier processing only once that first loop proves its value.
Filtering an event is like checking a receipt.
Counting those receipts, or deciding when a cart needs a nudge, takes memory. That memory is state. It's what turns passing data along into actually learning from it.
<a id="begin-with-stateless-enrichment"></a>
Begin With Stateless Enrichment
Start simple with stateless enrichment. A cart-add event comes in with a cart_id, product_id, and event_time. The processor tacks on campaign metadata, adds the utm_source, and passes it through. Each result depends on that one record alone.
Stateful processing is different. Think of it as a notebook sitting next to the processor. Kafka Streams keeps cart totals, last activity times, or campaign counts in a local state store. Because partitions keep events together, each cart usually has one clear owner.
<a id="choose-the-right-window"></a>
Choose The Right Window
A tumbling window is fixed buckets, like one-minute slices. It answers, “How many cart adds happened per minute?” Every event lands in exactly one bucket. Great for per-minute ops metrics, not so great for full shopping sessions.
A hopping window overlaps on purpose. A five-minute window sliding forward every minute means an event can show up in a few neighboring buckets. That helps you catch bursts that cross a minute line and compare against the prior interval. The tradeoff is more compute and double-counting, so make the overlap obvious on dashboards.
<a id="follow-the-shopper"></a>
Follow The Shopper
A session window follows the shopper, not the clock. It groups events together until an inactivity gap ends the session, say 30 minutes with no activity. Product views, searches, cart adds, and checkout starts become one journey across minute lines. That's how a merchant sees where a cart actually stalled.
<a id="flag-idle-high-value-carts"></a>
Flag Idle High-Value Carts
Now pair that session state with a threshold. Hold the latest cart value and last event time for each cart_id. When a cart tops $200 and goes quiet for 10 minutes, fire an alert. Cart Whisper | Live View Pro can flag those high-value idle carts, and its Cart ID lets support pull up that exact cart.
<a id="preserve-state-and-handle-late-events"></a>
Preserve State And Handle Late Events
Kafka Streams backs its state stores with a changelog topic. Every state change gets recorded, so after a restart it can rebuild the store and pick up where it left off. You get fault tolerance without needing another database as the source of truth.
Late data still needs a rule. Say a shopper loses signal and their cart-add hits Kafka after that minute already closed. A grace period holds the window open a little longer, letting that late event update the count. Too short and you miss real activity. Too long and alerts lag. Match the delay to how fast the merchant actually needs to act.
<a id="check-the-design-before-launching"></a>
Check The Design Before Launching
- Purpose: Fixed count, overlapping comparison, session summary, or immediate alert?
- State key: Does
cart_idgive you the ordering and ownership you need? - Idle threshold: What value and quiet period really warrant a follow-up?
Before you launch, test with a cart over $200, drop a shopper mid-session, and confirm the idle-cart alert fires just once after your grace period.
Performance planning comes with one uncomfortable truth: real time analytics with Kafka isn't free speed. Every replica, partition, retained byte, and cross-region hop adds resilience, capacity, or delay.
And that tradeoff shows up fast in testing.
One broker with 8 vCPUs, 8 partitions, 1 KB messages, and no replication pushed 2.8 million messages per second. Bump replication to two, and throughput dropped to 1.93 million messages per second — a 31% hit.
| Replication | Broker CPU | Partitions | Message Size | Throughput |
|---|---|---|---|---|
| 1 | 8 vCPUs | 8 | 1 KB | 2.8 million messages/second |
| 2 | 8 vCPUs | 8 | 1 KB | 1.93 million messages/second |
<a id="choose-partitions-as-parallel-lanes"></a>
Choose Partitions as Parallel Lanes
Partitions are Kafka's unit of parallelism. Think of them as lanes on a highway. More lanes let consumers spread the work, which is great — until a bad key choice sends every cart into one lane.
Then you've got a traffic jam.
Use cart_id as the key when add, remove, and checkout events for the same cart have to stay in order. Size your partition count against broker count and consumer concurrency, then actually watch for skew. More partitions don't automatically mean faster.
<a id="set-latency-by-business-decision"></a>
Set Latency by Business Decision
Latency targets belong to use cases, not platforms. An idle-cart alert for support might need sub-second delivery. A warehouse sink? It can wait minutes because batched writes are fine there.
For a growing store emitting product-view, search, cart, and order events, start with measured traffic and one replicated production setup. A global retailer with more event types across regions and brands will need more partitions, brokers, replication, and network headroom — plus a clear latency budget per consumer.
<a id="balance-retention-and-replay"></a>
Balance Retention and Replay
Retention controls how long you can replay events after a bug or when a new consumer comes online. Short retention saves on storage but closes that replay window fast. Longer retention helps with recovery and backfills, but you’ll pay for disk, compaction, and a solid deletion plan.
Resilience costs raw speed, so pick replication based on how much failure your business can actually afford.
<a id="apply-the-numbers-to-merchant-scale"></a>
Apply the Numbers to Merchant Scale
Treat those figures as sizing signals, not guarantees. They show the cost of protection in one controlled setup. Before you buy hardware, rerun the test with your own message sizes, keys, compression, consumer behavior, and replication settings.
For visual ideas, read our guide to real-time data visualization.
<a id="build-a-practical-capacity-plan"></a>
Build a Practical Capacity Plan
Measure arrival rates for product views, searches, cart changes, and orders. Then multiply peak traffic by average event size, replication, and burst headroom. A single growing store doesn't look anything like several global brands emitting events across regions.
Check Kafka’s official documentation for the config details, and test end-to-end delay from producer to dashboard. Tinybird’s guide is a useful reference on data freshness, query latency, concurrency, and retention.

Getting the pipeline running is the easy part. Keeping real time analytics with Kafka healthy in production is what decides if a shopper gets help in time or just gets silence.
<a id="watch-consumer-lag-first"></a>
Watch Consumer Lag First
Consumer lag is the gap between the newest event and the last one your app actually processed.
Think of checkout lines building faster than cashiers can clear them. Nothing is broken yet, but shoppers are waiting.
Track lag by consumer group, topic, and partition. A flat total can hide one struggling partition, and a sudden drop can mean the consumer stalled or skipped records.
<a id="combine-broker-and-application-signals"></a>
Combine Broker and Application Signals
Your Kafka cluster needs its own health check. Keep an eye on under-replicated partitions, offline brokers, request latency, throughput, disk pressure, and partition skew.
Then look at the app layer:
- processing errors and dead-letter volume
- records per second
- state-store size
- records processed vs. records received
A healthy broker can still feed a sick consumer, while a healthy consumer can't fix a sick cluster.
<a id="separate-operations-from-analytics"></a>
Separate Operations From Analytics
Don't tie live operations to your analytics database. If your dashboard store goes down, your stream processor should still catch an idle cart and send that recovery nudge.
Use Kafka for the operational work, then write copies to a warehouse or real-time analytics store. That split means a reporting outage won't slow down support. It also makes replays much easier when you need to rebuild a destination.
<a id="diagnose-common-failure-patterns"></a>
Diagnose Common Failure Patterns
| Symptom | Likely Cause | Practical Fix |
|---|---|---|
| Duplicate orders or metrics | At-least-once delivery | Use idempotent producers or deduplication keys |
| One partition runs hot | Poor key distribution | Salt keys or redesign the partitioning model |
| Consumers silently miscalculate | Schema drift | Enforce versioned schemas at the producer |
Duplicates usually happen when a consumer finishes the work, then crashes before committing the offset. Make the destination idempotent with an event ID, or dedupe before you apply the effect.
Hot partitions show up when one key — one country, one big customer — funnels all the traffic into one lane. Check throughput and lag per partition, then salt the key or rethink the model.
Schema drift is sneakier. The consumer keeps running, but a renamed field quietly turns into zeros. Validate schemas at the producer, set compatibility rules, and reject bad records early.
<a id="measure-business-outcomes"></a>
Measure Business Outcomes
Infra metrics tell you if the pipeline works. Business metrics tell you if it matters. One survey found 72% of Kafka users already run stream processing, with 68% planning to expand it — operational maturity is now table stakes.
Cart Whisper | Live View Pro closes that loop on its Growth plan by tracking opened, clicked, and converted events. You can tie an alert to a message reply, then actually see if that reply turned into a sale.
Start with one dashboard for lag, replication, errors, and state-store growth. Alert on business thresholds like sustained lag or repeated delivery failures. And link every critical alert to a tracked recovery action, because observability should end with a happier customer, not another unread notification. Explore Cart Whisper | Live View Pro to see how live cart signals can guide support and recovery workflows.
The infographic lays out two practical Real Time Analytics with Kafka workflows that commerce teams actually use: live cart recovery and journey analytics.
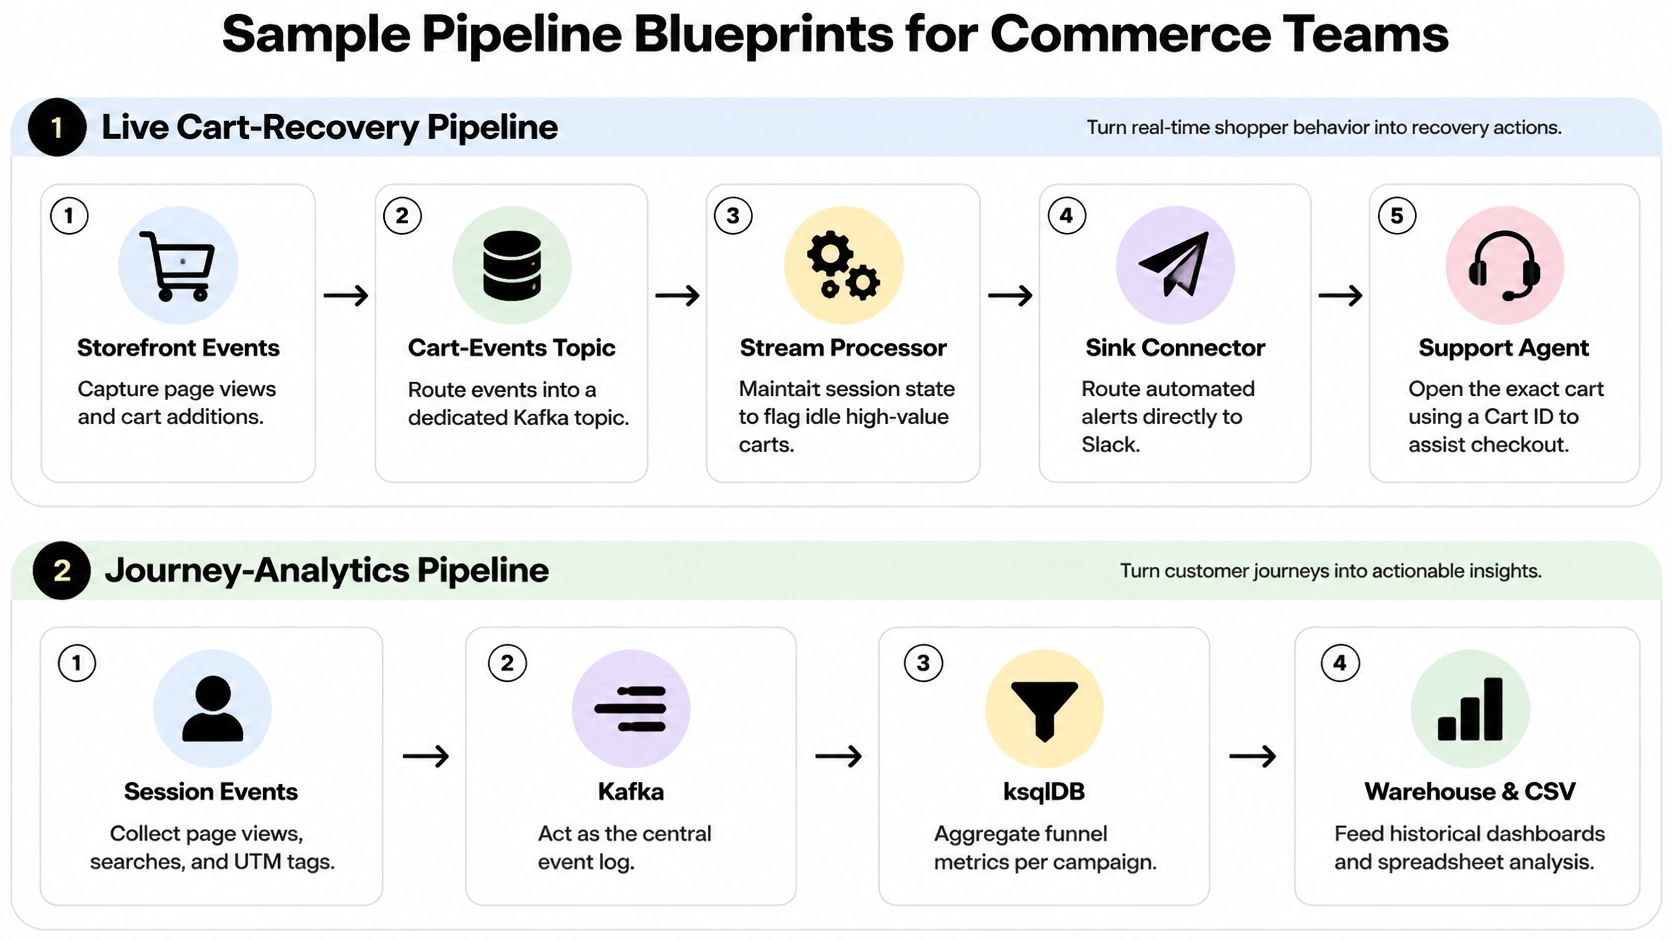
The difference comes down to purpose. One pipeline turns events into immediate help at checkout. The other turns them into funnel and campaign insight.
<a id="build-a-live-cart-recovery-pipeline"></a>
Build a Live Cart-Recovery Pipeline
It starts at the storefront. Every cart_created, item_added, item_removed, and checkout_started event gets published to cart-events, keyed by cart_id so each cart stays in order.
Your schema needs event_id, cart_id, customer_id, item_id, quantity, cart_value, currency, event_time, and source. A Kafka Streams processor then holds session state, cart value, and last activity.
| Stage | Latency Budget |
|---|---|
| Storefront to Kafka | 100 ms |
| Kafka to processor | 250 ms |
| State evaluation | 500 ms |
| Slack delivery | 1 second |
| End-to-end target | Under 2 seconds |
A Kafka Connect sink pushes qualified alerts straight to Slack. Support opens that exact cart with its Cart ID and helps the shopper finish. Cart Whisper | Live View Pro handles this natively, with high-value idle-cart alerts and Slack integration built in.
“The Cart ID feature is something we rely on every day.” RES LLC Store
<a id="build-a-journey-analytics-pipeline"></a>
Build a Journey-Analytics Pipeline
This second blueprint is about the bigger picture. It captures page views, searches, and UTM-tagged sessions, sends them to Kafka, then uses ksqlDB to roll up sessions and funnel steps by campaign_id, utm_source, device_type, and time window.
Include session_id, user_id, page_path, search_query, campaign_id, utm_source, device_type, and event_time in the schema. A warehouse sink keeps the history, while a CSV export makes spreadsheet analysis easy.
| Stage | Latency Budget |
|---|---|
| Events to Kafka | 500 ms |
| ksqlDB aggregation | 5 seconds |
| Warehouse write | 2 minutes |
| Dashboard freshness | Under 5 minutes |
The warehouse can live with minutes of delay because it is for trend analysis, not for saving a checkout in progress. For broader architecture guidance, Tinybird’s real-time analytics guide explains why freshness and query latency should be measured separately.
<a id="compare-the-two-pipelines"></a>
Compare the Two Pipelines
| Pipeline | Purpose | Processing Tool | Sink | Acceptable Delay |
|---|---|---|---|---|
| Cart recovery | Act during checkout | Kafka Streams | Slack | 2 seconds |
| Journey analytics | Measure funnels | ksqlDB | Warehouse, CSV | 5 minutes |
Start with one topic, one consumer, and one business action. Prove the loop works, then add more events and destinations.
Recommendation engines and dynamic pricing are natural next steps once that foundation holds up. Start by publishing one cart event and measuring end-to-end latency with Cart Whisper | Live View Pro.
<a id="does-a-small-shopify-store-need-kafka"></a>
Does a Small Shopify Store Need Kafka?
Honestly? Probably not.
If you're running a small Shopify store, a managed app gets you there faster with zero ops headache. Cart Whisper | Live View Pro shows you live visitors and cart activity right out of the box — no clusters to tune, no offsets to babysit.
Kafka makes sense when you have independent systems that all need to read and replay the same event stream. Until then, start with the simpler tool.
<a id="how-does-kafka-differ-from-rabbitmq-for-analytics"></a>
How Does Kafka Differ From RabbitMQ for Analytics?
Think of it like this: Kafka keeps the history, RabbitMQ delivers the message.
Kafka stores a durable, replayable log you can rewind and reuse. RabbitMQ is built for transient delivery — get the task to a worker and move on. That makes Kafka a better fit for shared history, consumer groups, and rebuilding destinations from scratch.
Bottom line: choose Kafka for event streams, RabbitMQ for work queues.
<a id="what-happens-if-a-consumer-crashes-mid-processing"></a>
What Happens if a Consumer Crashes Mid-Processing?
It picks up where it left off.
Consumers resume from their last committed offset, and anything uncommitted replays. That’s why your handlers need to be idempotent.
The rule to remember: commit only after durable output, and deduplicate with event IDs.
<a id="can-kafka-feed-machine-learning-models"></a>
Can Kafka Feed Machine Learning Models?
Yes — and that’s where it gets interesting.
Live customer events flow into feature pipelines that power churn scores, fraud checks, and recommendations. It’s already common in production, with surveys putting fraud detection at 26% and recommendation engines at 35%.
Keep your training data historical, but score the action live.
Cart Whisper | Live View Pro gives you live visitor context, idle-cart alerts, and Slack recovery workflows for Shopify stores — without the Kafka complexity.